1. Computed Tomography
Abstract
Cardiac CT scanners are rapidly improving, each major vendor has introduced a state of the art scanner every 23 years. The basic applications, terminology and acquisition has not changed dramatically, however, improvements in hardware and software continue to reduce radiation exposure, scan times, artifacts and improve image quality. This chapter outlines the basic CT terminology, functions and background behind the current state of CT scanners for cardiac applications. It reviews spatial, temporal and contrast resolution limits of the CT scanners. An overview of common terms, radiation exposure and protocols are included. This acts as an introductory chapter to be expanded by subsequent chapters that will each go into more details on specific topics. Comparison to magnetic resonance for image quality and functionality, and dose comparisons to mammography, nuclear and fluoroscopy are included.
Overview of X-ray Computed Tomography
The development of computed tomography (CT), resulting in widespread clinical use of CT scanning by the early 1980s, was a major breakthrough in clinical diagnosis across multiple fields. The primary advantage of CT was the ability to obtain thin cross-sectional axial images, with improved spatial resolution over ultrasound, nuclear medicine, and magnetic resonance imaging. This imaging avoided super-position of three-dimensional (3-D) structures onto a planar 2-D representation, as is the problem with conventional projection X-ray (fluoroscopy). CT images, which are inherently digital and thus quite robust, are amenable to 3-D computer reconstruction, allowing for ultimately nearly an infinite number of projections. From a cardiac perspective, the increased spatial resolution is the reason for its increase in sensitivity for atherosclerosis, plaque detection and coronary artery disease (CAD). With CT, smaller objects can be seen with better image quality. Localization of structures (in any plane) is more accurate and easier with tomography than with projection imaging like fluoroscopy. The exceptional contrast resolution of CT (ability to differentiate fat, air, tissue and water), allows visualization of more than the lumen or stent, but rather the plaque, artery wall and other cardiac and non-cardiac structures simultaneously.
The basic principle of CT is that a fan-shaped, thin X-ray beam passes through the body at many angles to allow for cross-sectional imaging. The corresponding X-ray transmission measurements are collected by a detector array. Information entering the detector array and X-ray beam itself is collimated to produce thin sections while avoiding unnecessary photon scatter (to keep radiation exposure and image noise to a minimum). The x-ray tub and detector array rotate around the patient separated by 180, allowing continuous acquisition of data. The data recorded by the detectors are digitized into picture elements (pixels) with known dimensions. The gray-scale information contained in each individual pixel is reconstructed according to the attenuation of the X-ray beam along its path using a standardized technique termed filtered back projection. Gray-scale values for pixels within the reconstructed tomogram are defined with reference to the value for water and are called Hounsfield units (HU; for the 1979 Nobel Prize winner, Sir Godfrey N. Hounsfield), or simply CT numbers. These CT numbers are the attenuation or brightness of the individual pixel (smallest definable unit on CT) of data. A three dimensional pixel is called a voxel. Typical pixel values for studies commonly seen on cardiac CT are listed in Table .
Table 1.1
Typical Hounsfield unit values
Air~1000 HU |
Fat 100 to 40 |
Water zero |
Non-enhanced myocardium and blood 4060 |
Contrast enhanced myocardium 80140 |
Calcium >130 (to about 1000) |
Enhanced blood pools (lumen, aorta, LV) 300500 |
Metal >1000 |
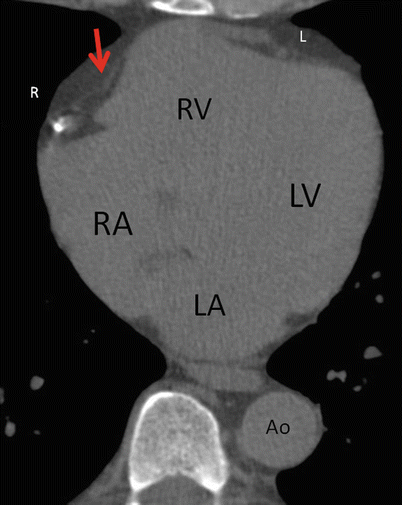
Dr Hounsfield is credited with the invention of the CT scanner in late 1960s. Since CT uses X-ray absorption to create images, the differences in the image brightness at any point will depend on physical density and the presence of atoms with a high difference in anatomic number like calcium, and soft tissue and water. The absorption of the X-ray beam by different atoms will cause differences in CT brightness on the resulting image (contrast resolution). Blood and soft tissue (in the absence of vascular contrast enhancement) have similar density and consist of similar proportions of the same atoms (hydrogen, oxygen, carbon). Bone has an abundance of calcium and is thus brighter on CT. Fat has an abundance of hydrogen. Lung contains air which is of extremely low physical density and appears black on CT (HU 1000). The higher the density, the brighter the structure on CT. Calcium is bright white, air is black, and muscle or blood is gray. There are over 5000 shades of this gray scale represented on CT, centered around zero (water-gray). Computed tomography, therefore, can distinguish blood from air, fat and bone but not readily from muscle or other soft tissue. The densities of blood, myocardium, thrombus, and fibrous tissues are so similar in their CT number, that non-enhanced CT cannot distinguish these structures. Thus, the ventricles and other cardiac chambers can be seen on non-enhanced CT, but delineating the wall from the blood pool is not possible (Fig. ].
Fig. 1.1
A non-contrast CT scan of the heart. Quite a bit of information can be garnered without contrast. The pericardium is visible as a thin line just below the R and L. The coronary arteries can be seen, and diameters and calcifications are present. The right coronary artery is seen near the R, the left anterior at the L, and the circumflex at the C. The four chambers of the heart are also seen, and relative sizes can be measured from this non-contrast study. The interatrial septum is clearly seen ( red arrow ). The ascending aorta is also present on this image and can be evaluated. Ao aorta, L left anterior descending artery, LA left atrium, LV left ventricle, RA right atrium, RV right ventricle
Because contrast resolution uses attenuation or density to visualize structures in gray scale, limitations of contrast resolution exist even on contrast enhanced studies. These include differentiating the cardiac vessels from cardiac cavities with same density (such as when the arteries run become intra-myocardial), and differentiating non-calcified plaque from surrounding low density structures, including thrombus. Even with good contrast enhancement, differentiating different types of plaque (lipid-laden and fibrous) can sometimes be challenging, although it is always easy to differentiate the bright white plaques (calcified) from non-calcific plaques.
The higher spatial resolution of CT allows visualization of coronary arteries both with and without contrast enhancement. The ability to see the coronary arteries on a non-contrast study depends upon the fat surrounding the artery (of lower density, thus more black on images), providing a natural contrast between the myocardium and the epicardial artery (Fig.. Coronary artery calcium in coronary atherosclerosis (consisting of the same calcium phosphate as in bone) has CT number >130 HU, typically going as high as +1000 HU. It does not go as high as the bony cortex of the spine due to the smaller quantity and mostly inhomogeneous distribution in the coronary artery plaque. Metal, such as that found in valves, wires, stents and surgical clips, typically have densities of +1000 HU or higher.

