Margot Tollefson
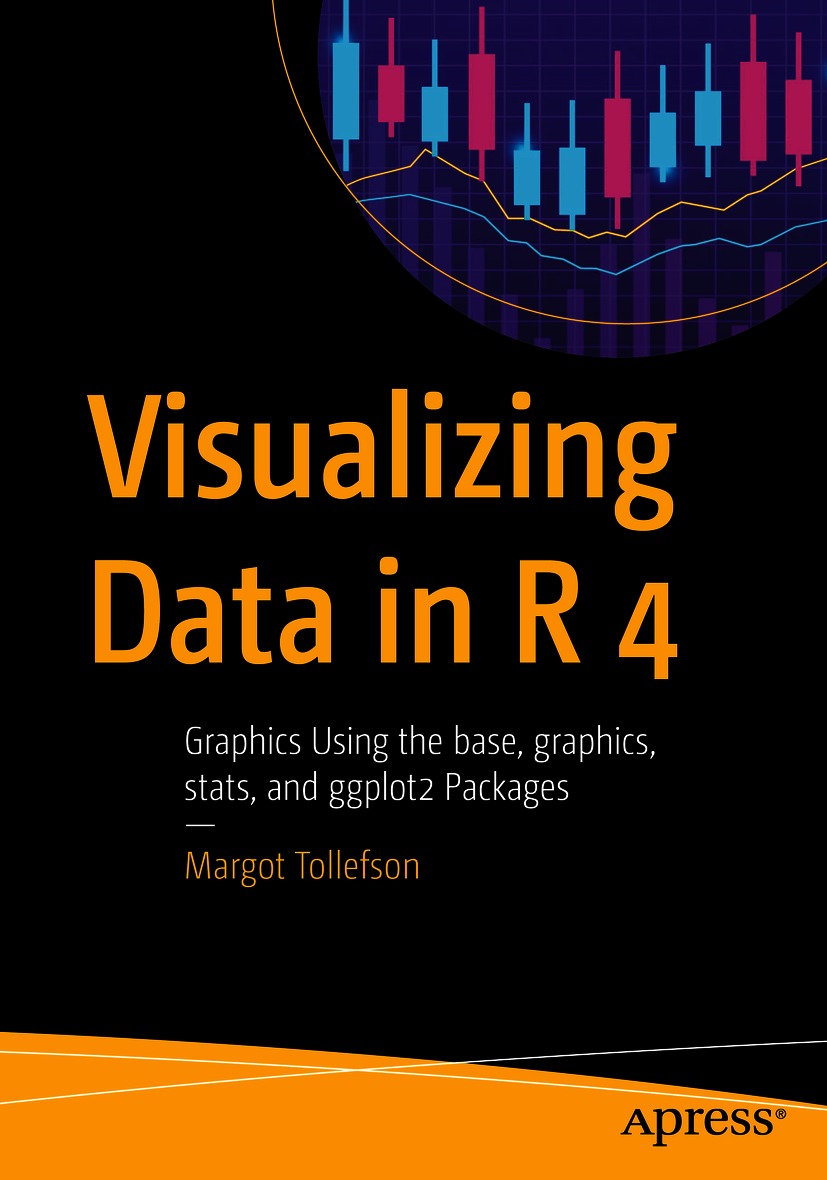
Visualizing Data in R 4
Graphics Using the base, graphics, stats, and ggplot2 Packages
1st ed.

Logo of the publisher
Margot Tollefson
Stratford, IA, USA
Any source code or other supplementary material referenced by the author in this book is available to readers on GitHub via the books product page, located at www.apress.com/9781484268308 . For more detailed information, please visit http://www.apress.com/source-code .
ISBN 978-1-4842-6830-8 e-ISBN 978-1-4842-6831-5
https://doi.org/10.1007/978-1-4842-6831-5
Margot Tollefson 2021
This work is subject to copyright. All rights are reserved by the Publisher, whether the whole or part of the material is concerned, specifically the rights of translation, reprinting, reuse of illustrations, recitation, broadcasting, reproduction on microfilms or in any other physical way, and transmission or information storage and retrieval, electronic adaptation, computer software, or by similar or dissimilar methodology now known or hereafter developed.
The use of general descriptive names, registered names, trademarks, service marks, etc. in this publication does not imply, even in the absence of a specific statement, that such names are exempt from the relevant protective laws and regulations and therefore free for general use.
The publisher, the authors and the editors are safe to assume that the advice and information in this book are believed to be true and accurate at the date of publication. Neither the publisher nor the authors or the editors give a warranty, expressed or implied, with respect to the material contained herein or for any errors or omissions that may have been made. The publisher remains neutral with regard to jurisdictional claims in published maps and institutional affiliations.
Distributed to the book trade worldwide by Apress Media, LLC, 1 New York Plaza, New York, NY 10004, U.S.A. Phone 1-800-SPRINGER, fax (201) 348-4505, e-mail orders-ny@springer-sbm.com, or visit www.springeronline.com. Apress Media, LLC is a California LLC and the sole member (owner) is Springer Science + Business Media Finance Inc (SSBM Finance Inc). SSBM Finance Inc is a Delaware corporation.
For Clay.
Acknowledgments
I would like to acknowledge the Comprehensive R Archive Network (CRAN). Without the R documentation, for which the Comprehensive R Archive Network is responsible, this book could not have been written. Also, my husband, Clay, for bearing with me while I wrote.
Table of Contents
Part I: An Overview of plot( )
Part II: A Look at the ggplot2 Package
Part III: Appendixes
About the Author
Margot Tollefson PhD
is a semiretired freelance statistician, with her own consulting business, Vanward Statistics. She received her PhD in statistics from Iowa State University and has many years of experience applying R to statistical research problems. Dr. Tollefson has chosen to write this book because she often creates graphics using R and would like to share her knowledge and experience. Her professional blog is on WordPress at vanwardstat. She has social media accounts on LinkedIn, Facebook, and Twitter. Her social media name is @vanstat on Twitter.
About the Technical Reviewer
Tom Barker
is an engineer and technology leader, a professor, and an author. He has authored several books on web development, data visualization, and technical leadership, including High Performance Responsive Design, Intelligent Caching, Pro JavaScript Performance: Monitoring and Visualization, and Pro Data Visualization Using R and JavaScript.
Margot Tollefson 2021
M. Tollefson Visualizing Data in R 4 https://doi.org/10.1007/978-1-4842-6831-5_1
1. Introduction: plot( ), qplot( ), and ggplot( ), Plus Some
R provides many ways to visualize data. Graphics in the R language are generated by functions. Some functions create useful visualizations almost instantly. Other functions combine together to create highly coded sophisticated images. This book shows you how to generate both types of objects.
In the first part of this book, we look in detail at the plot() function the most basic and versatile of the plotting functions. The functions par(), layout(), and split.screen(), which set global plotting parameters and layout options, are also described, as well as graphics devices.
The second part covers the functions in the ggplot2 package, starting with qplot() and ggplot() . The functions qplot() and ggplot() are simpler to use in many ways than the earlier R functions. Truthfully, the syntax used in the ggplot2 package requires long strings of names and arguments but the autocomplete function in RStudio makes code entry quite easy.
The third part of the book includes six appendixes containing the canned plotting functions in the graphics and stats packages. The appendixes are sorted by the type of object to be displayed.
1.1 plot( ), par( ), layout( ), and split.screen( )
The function plot() takes an object or objects and creates an image based on the class of the object(s). There are many arguments to plot() that affect the appearance of the image. The arguments can be given values within the call to plot(), or many can be assigned globally using the function par(). After the initial call to plot(), there are several ancillary functions that can be used to add to the image. If having more than one plot on a page is the goal of the user, the functions par(), layout() , or split.screen() can be used to set up the format for multiple plots.
In Chapter , the possible arguments to the function par() are described, and a way to set up multiple plots using par(), layout() or split.screen() is given. Also, graphics devices are covered.
1.2 qplot( ) and ggplot( )
The functions qplot() and ggplot() in the ggplot2 package provide alternatives to plot(). Default plots generated by qplot() and ggplot() tend to look nicer than default plots generated by plot(). For simple plots, qplot() is sufficient to give an elegant-looking graphic. The function ggplot() provides for more plotting options than qplot(). Some of the syntax used in the ggplot2 package is not used in standard R.
In ggplot2, a theme for a graphic can be defined using theme() or by a canned theme function beginning with theme_. The objects to be plotted are mappings and are assigned in the function aes(). The type of image to be displayed is a geometry or statistic and is assigned by functions beginning with geom_ or stat_. The appearance of the graphic can be changed by using aes(), aes_ functions, geom_ functions, stat_ functions, and/or other formatting functions. More than one aesthetic, geometry, and statistic can be used to create an image. The appearance of the image can be changed by running a formatting function from within another function or by running a formatting function separately.
In Chapter goes over various functions in the ggplot2 package that also change the appearance of the image.

