• Complain

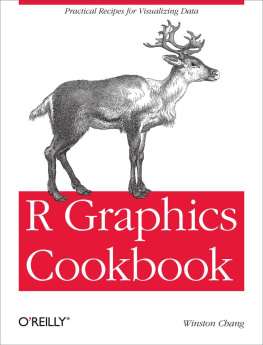
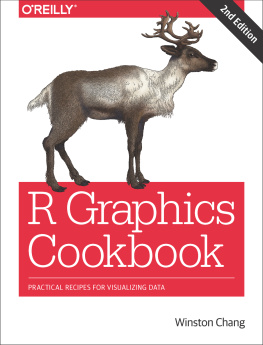
Winston Chang - R Graphics Cookbook Practical Recipes for Visualizing Data

Here you can read online Winston Chang - R Graphics Cookbook Practical Recipes for Visualizing Data full text of the book (entire story) in english for free. Download pdf and epub, get meaning, cover and reviews about this ebook. year: 2018, publisher: O’Reilly Media, genre: Science. Description of the work, (preface) as well as reviews are available. Best literature library LitArk.com created for fans of good reading and offers a wide selection of genres:

Romance novel Science fiction Adventure Detective Science History Home and family Prose Art Politics Computer Non-fiction Religion Business Children Humor

Choose a favorite category and find really read worthwhile books. Enjoy immersion in the world of imagination, feel the emotions of the characters or learn something new for yourself, make an fascinating discovery.

Winston Chang R Graphics Cookbook Practical Recipes for Visualizing Data
  • Book:
    R Graphics Cookbook Practical Recipes for Visualizing Data
  • Author:
  • Publisher:
    O’Reilly Media
  • Genre:
  • Year:
    2018
  • Rating:
    5 / 5
  • Favourites:
    Add to favourites
  • Your mark:
    • 100
    • 1
    • 2
    • 3
    • 4
    • 5

R Graphics Cookbook Practical Recipes for Visualizing Data: summary, description and annotation

We offer to read an annotation, description, summary or preface (depends on what the author of the book "R Graphics Cookbook Practical Recipes for Visualizing Data" wrote himself). If you haven't found the necessary information about the book — write in the comments, we will try to find it.

The target audience is anyone who wants to do high-quality data visualization, but hasnt memorized every command and doesnt want to spend lots of time searching the internet every time they make a graph. This includes scientists, engineers, computer programmers, and data analysts of all kinds. The target skill level ranges from those who have just learned the basics of R to those who are experts. Even those of us who work with R on a daily basis can benefit from a cookbook-style reference.

Winston Chang: author's other books


Who wrote R Graphics Cookbook Practical Recipes for Visualizing Data? Find out the surname, the name of the author of the book and a list of all author's works by series.

R Graphics Cookbook Practical Recipes for Visualizing Data — read online for free the complete book (whole text) full work

Below is the text of the book, divided by pages. System saving the place of the last page read, allows you to conveniently read the book "R Graphics Cookbook Practical Recipes for Visualizing Data" online for free, without having to search again every time where you left off. Put a bookmark, and you can go to the page where you finished reading at any time.

Light

Font size:

Reset

Interval:

Bookmark:

Make
R Graphics Cookbook

by Winston Chang

Copyright 2019 Winston Chang. All rights reserved.

Printed in the United States of America.

Published by OReilly Media, Inc. , 1005 Gravenstein Highway North, Sebastopol, CA 95472.

OReilly books may be purchased for educational, business, or sales promotional use. Online editions are also available for most titles (http://oreilly.com/safari). For more information, contact our corporate/institutional sales department: 800-998-9938 or corporate@oreilly.com .

  • Editor: Michele Cronin
  • Production Editor: Nicholas Adams
  • Copyeditor: Kim Cofer
  • Proofreader: Christina Edwards
  • Indexer: Angela Howard
  • Interior Designer: David Futato
  • Cover Designer: Karen Montgomery
  • Illustrator: Rebecca Demarest
  • December 2012: First Edition
  • November 2018: Second Edition
Revision History for the Second Edition
  • 2018-10-25: First Release

See http://oreilly.com/catalog/errata.csp?isbn=9781491978603 for release details.

The OReilly logo is a registered trademark of OReilly Media, Inc. R Graphics Cookbook, the cover image, and related trade dress are trademarks of OReilly Media, Inc.

The views expressed in this work are those of the author, and do not represent the publishers views. While the publisher and the author have used good faith efforts to ensure that the information and instructions contained in this work are accurate, the publisher and the author disclaim all responsibility for errors or omissions, including without limitation responsibility for damages resulting from the use of or reliance on this work. Use of the information and instructions contained in this work is at your own risk. If any code samples or other technology this work contains or describes is subject to open source licenses or the intellectual property rights of others, it is your responsibility to ensure that your use thereof complies with such licenses and/or rights.

R Graphics Cookbook is available under the Creative Commons Attribution 4.0 International Public License.

978-1-491-97860-3

[LSI]

Preface

When the first edition of this book was published five years ago, thephrase data science had only recently entered the popular lexicon.Today, the phrase is unavoidable if youre involved with the sciences,journalism, or high-tech industries. Many interrelated developments havemade this possible: theres a general awareness that understandingquantitative data has tangible benefits; there are better and morewidely available educational resources about how to do data science; andfinally, the tools have evolved, becoming easier to use and get startedwith.

The goal of this book is to help you understand your data by visualizingit, and to help you convey that understanding to others. You can thinkof data analysis as the process of transforming raw data into ideas insomebodys mind. One of the key techniques for doing this is to createvisualizations of the data. Our brains have very highly developed visualpattern detection systems, and data visualizations are a way toefficiently use those visual systems to get quantitative informationinto a persons mind.

Each recipe in this book lists a problem and a solution. In most cases,the solutions I offer arent the only way to do things in R, but theyare, in my opinion, the best way. One of the reasons for Rs popularityis that there are many available add-on packages, each of which providessome functionality for R. There are many packages for visualizing datain R, but this book primarily uses ggplot2.

This book isnt meant to be a comprehensive manual of all the differentways of creating data visualizations in R, but hopefully it will helpyou figure out how to make the graphics you have in mind. Or, if yourenot sure what you want to make, browsing its pages may give you someideas about whats possible.

Recipes

This book is intended for readers who have at least a basicunderstanding of R. The recipes in this book will show you how to dospecific tasks. Ive tried to use examples that are simple, so that youcan understand how they work and transfer the solutions over to your ownproblems.

Software and Platform Notes

Most of the recipes here use the ggplot2 plotting package, and the dplyrpackage for data wrangling. These packages are both part of thetidyverse, which is a collection of R packages that make it easier towork with data. Some of the recipes require the most recent version ofggplot2, 3.0.0, and this in turn requires a relatively recent version ofR. You can always get the latest version of R from the main R projectsite, http://www.r-project.org.

Note

You can use the recipes with just a surface understanding of ggplot2,but if you want a deeper understanding of how it works, see .

Once youve installed R, you can install the necessary packages. Inaddition to the tidverse packages, youll also want to install thegcookbook package, which contains data sets for many of the examples inthis book. You can install the tidyverse packages and the gcookbookpackage with:

install.packages("tidyverse")install.packages("gcookbook")

You may be asked to choose a mirror site for CRAN, the Comprehensive RArchive Network. Any of the sites should work, but its a good idea tochoose one close to you because it will likely be faster than one faraway. Once youve installed the packages, load the ggplot2 and dplyrpackages in each R session in which you want to use the recipes in thisbook:

library(ggplot2)library(dplyr)

The recipes in this book will assume that youve already loaded ggplot2and dplyr, so they wont show these lines of code.

If you see an error like this, it means that you forgot to load ggplot2:

Error: could not find function "ggplot"

The major platforms for R are macOS, Linux, and Windows, and all therecipes in this book should work on all of these platforms. There aresome platform-specific differences when it comes to creating bitmapoutput files, and these differences are .

Conventions Used in This Book

The following typographical conventions are used in this book:

Italic

Indicates new terms, URLs, email addresses, filenames, and file extensions.

Constant width

Used for program listings, as well as within paragraphs to refer to program elements such as variable or function names, databases, data types, environment variables, statements, and keywords.

Constant width bold

Shows commands or other text that should be typed literally by the user.

Constant width italic

Shows text that should be replaced with user-supplied values or by values determined by context.

Tip

This element signifies a tip or suggestion.

Note

This element signifies a general note.

Warning

This element indicates a warning or caution.

OReilly Safari
Note

Safari (formerly Safari Books Online) is a membership-based training and reference platform for enterprise, government, educators, and individuals.

Members have access to thousands of books, training videos, Learning Paths, interactive tutorials, and curated playlists from over 250 publishers, including OReilly Media, Harvard Business Review, Prentice Hall Professional, Addison-Wesley Professional, Microsoft Press, Sams, Que, Peachpit Press, Adobe, Focal Press, Cisco Press, John Wiley & Sons, Syngress, Morgan Kaufmann, IBM Redbooks, Packt, Adobe Press, FT Press, Apress, Manning, New Riders, McGraw-Hill, Jones & Bartlett, and Course Technology, among others.

Next page
Light

Font size:

Reset

Interval:

Bookmark:

Make

Similar books «R Graphics Cookbook Practical Recipes for Visualizing Data»

Look at similar books to R Graphics Cookbook Practical Recipes for Visualizing Data. We have selected literature similar in name and meaning in the hope of providing readers with more options to find new, interesting, not yet read works.


Reviews about «R Graphics Cookbook Practical Recipes for Visualizing Data»

Discussion, reviews of the book R Graphics Cookbook Practical Recipes for Visualizing Data and just readers' own opinions. Leave your comments, write what you think about the work, its meaning or the main characters. Specify what exactly you liked and what you didn't like, and why you think so.