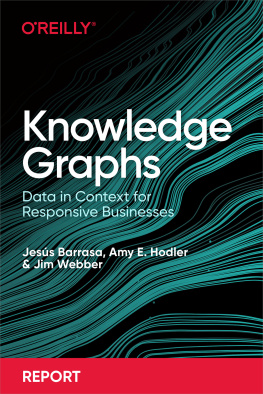
Jesus Barrasa - Knowledge Graphs
Here you can read online Jesus Barrasa - Knowledge Graphs full text of the book (entire story) in english for free. Download pdf and epub, get meaning, cover and reviews about this ebook. year: 2021, publisher: OReilly Media, Inc., genre: Politics. Description of the work, (preface) as well as reviews are available. Best literature library LitArk.com created for fans of good reading and offers a wide selection of genres:
Romance novel
Science fiction
Adventure
Detective
Science
History
Home and family
Prose
Art
Politics
Computer
Non-fiction
Religion
Business
Children
Humor
Choose a favorite category and find really read worthwhile books. Enjoy immersion in the world of imagination, feel the emotions of the characters or learn something new for yourself, make an fascinating discovery.
- Book:Knowledge Graphs
- Author:
- Publisher:OReilly Media, Inc.
- Genre:
- Year:2021
- Rating:3 / 5
- Favourites:Add to favourites
- Your mark:
- 60
- 1
- 2
- 3
- 4
- 5
Knowledge Graphs: summary, description and annotation
We offer to read an annotation, description, summary or preface (depends on what the author of the book "Knowledge Graphs" wrote himself). If you haven't found the necessary information about the book — write in the comments, we will try to find it.
Knowledge Graphs — read online for free the complete book (whole text) full work
Below is the text of the book, divided by pages. System saving the place of the last page read, allows you to conveniently read the book "Knowledge Graphs" online for free, without having to search again every time where you left off. Put a bookmark, and you can go to the page where you finished reading at any time.
Font size:
Interval:
Bookmark:

by Jess Barrasa , Amy E. Hodler , and Jim Webber
Copyright 2021 OReilly Media. All rights reserved.
Printed in the United States of America.
Published by OReilly Media, Inc. , 1005 Gravenstein Highway North, Sebastopol, CA 95472.
OReilly books may be purchased for educational, business, or sales promotional use. Online editions are also available for most titles (http://oreilly.com). For more information, contact our corporate/institutional sales department: 800-998-9938 or corporate@oreilly.com .
- Acquisitions Editor: Rebecca Novack
- Developmental Editor: Corbin Collins
- Production Editor: Kristen Brown
- Copyeditor: Shannon Turlington
- Interior Designer: David Futato
- Cover Designer: Randy Comer
- Illustrator: Kate Dullea
- July 2021: First Edition
- 2021-07-26: First Release
The OReilly logo is a registered trademark of OReilly Media, Inc. Knowledge Graphs, the cover image, and related trade dress are trademarks of OReilly Media, Inc.
The views expressed in this work are those of the authors, and do not represent the publishers views. While the publisher and the authors have used good faith efforts to ensure that the information and instructions contained in this work are accurate, the publisher and the authors disclaim all responsibility for errors or omissions, including without limitation responsibility for damages resulting from the use of or reliance on this work. Use of the information and instructions contained in this work is at your own risk. If any code samples or other technology this work contains or describes is subject to open source licenses or the intellectual property rights of others, it is your responsibility to ensure that your use thereof complies with such licenses and/or rights.
This work is part of a collaboration between OReilly and Neo4j. See our statement of editorial independence.
978-1-098-10485-6
[LSI]
The winners in the data industry know where the puck is going: making data smarter. This can be accomplished by integrating data with knowledge at scale, and this is where knowledge graphs come in. This book is a practical guide to understand what knowledge graphs are and why you should care. Importantly, it strikes the right balance between technical aspects and corresponding business value for an organization. If you need to make the business case for knowledge graphs, this is the book for you!
Lets first talk about the elephant in the room: RDF versus property graphs. Over the years, Ive enjoyed my conversations with Jess Barrasa on this topic. We have always been strong believers that these technologies will converge because at the end of the day, its all just a graph! This book is evidence of this convergence: enriching the property graph model with taxonomies, ontologies, and semantics in order to create knowledge graphs. And dont forget that the conversation should focus on the business value and not just the technology.
How do you get started on your knowledge graph journey?
First, one of my mantras is dont boil the ocean. This means that your knowledge graph journey should start simple, be practical, and focus on the business return coming from the right amount of semantics. Second, I always say that you need to crawl, walk, and run. Crawling means to start by creating a knowledge graph of your metadata that catalogs the data within your organization. Im thrilled to see that we are fully aligned: effective data integration solutions rely on understanding the relationships between data assets, which is at the heart of knowledge graphs. Furthermore, in the AI and ML era that we live in, understanding the quality and governance is key for effective decision-making.
Speaking of AI, knowledge graphs are changing AI by providing context. This leads to explainability, diversification, and improved processing. If AI is changing the future and knowledge graphs are changing AI, then by transitivity, knowledge graphs are also changing the future.
If you are still asking yourself why knowledge graphs?, guess what...your competitors arent! Dont be that person! Jess, Amy, and Jim have written this book just for you.
Juan Sequeda, PhD
Principal Scientist, data.world
July 2021
Graph data has become ubiquitous in the last decade.Graphs underpin everything from consumer-facing systems like navigation and social networks, to critical infrastructure like supply chains and policing.A consistent theme has emerged that applying knowledge in context is the single most powerful tool that most businesses have.Through research and experience, a set of patterns and practices called knowledge graphs has been developed to support extracting knowledge from data.
This report is for information technology professionals who are interested in managing and exploiting data for value.For the CIO or CDO, the report is brief yet thorough enough to provide an overview of the techniques and how they are delivered.For the data professional, data scientist, or software professional, this report provides an easy on-ramp to the world of knowledge graphs, and a language for discussing their implementation with peers and management .
Our fundamental tenet is that knowledge graphs are useful because they provide contextualized understanding of data.They achieve this by adding a layer of metadata that imposes rules for structure and interpretation.Well illustrate how using knowledge graphs can help extract greater value from existing data, drive automation and process optimization, improve predictions, and enable an agile response to changing business environments.
This chapter explains the background and motivation behind knowledge graphs.To do so, well discuss graphs and graph data and show how we can build systems with smarter data using knowledge graph techniques.
Knowledge graphs are a type of graph, so its important to have a basic understanding of graphs before we go much further.Graphs are simple structures where we use nodes (or vertices) connected by relationships (or edges) to create high-fidelity models of a domain.To avoid any confusion, the graphs we talk about in this book have nothing to do with visualizing data as histograms or plotting a function, which we consider to be charts, as shown in .
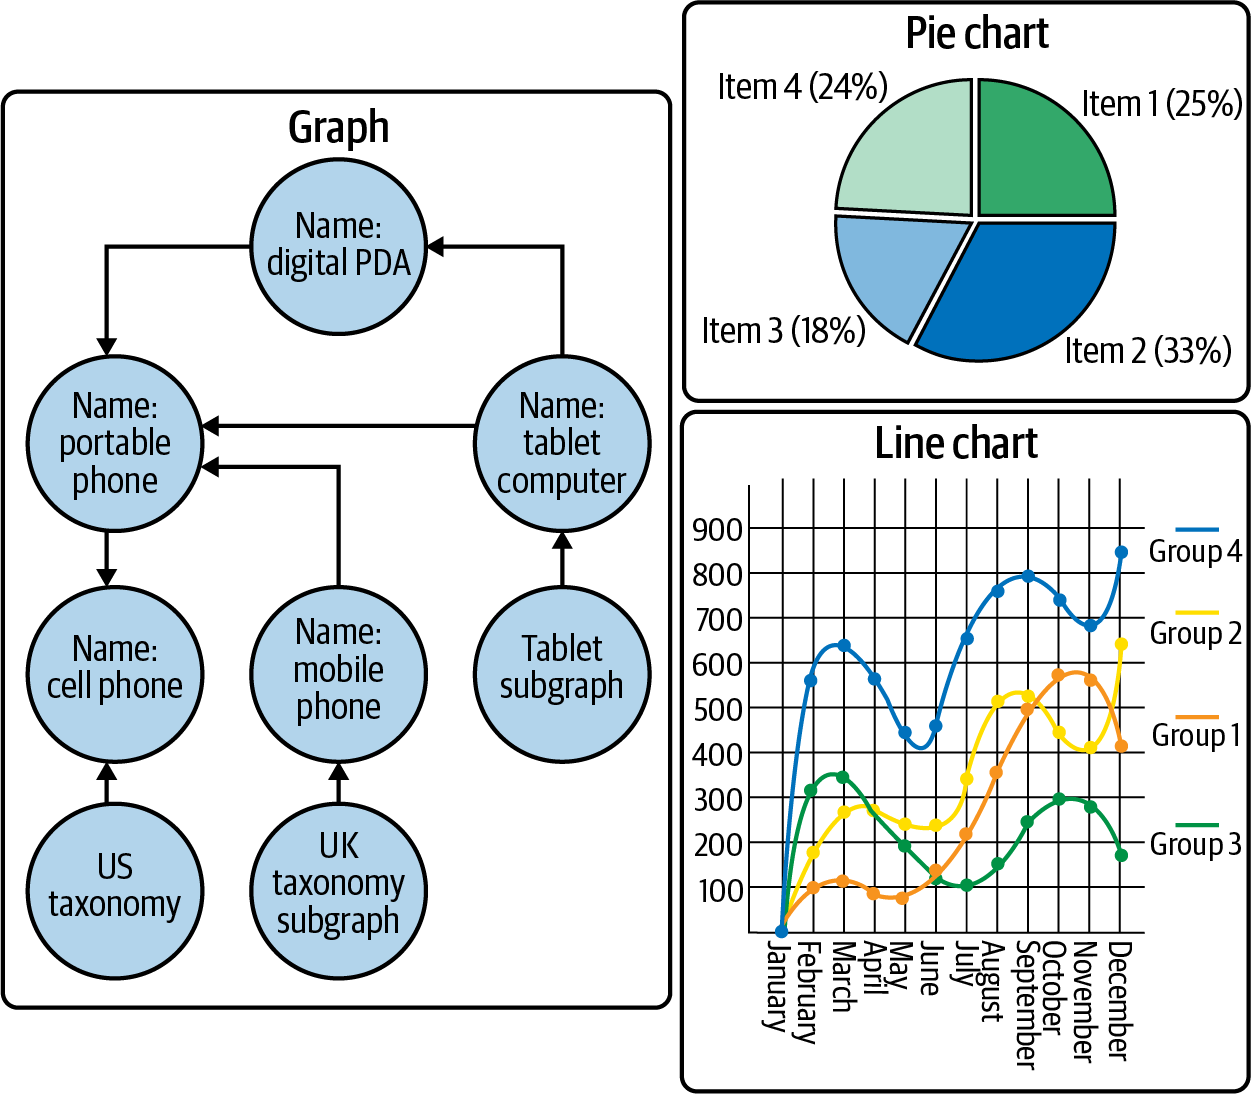
The graphs we talk about in this book are sometimes referred to as networks.They are a simple but powerful way of describing how things connect.
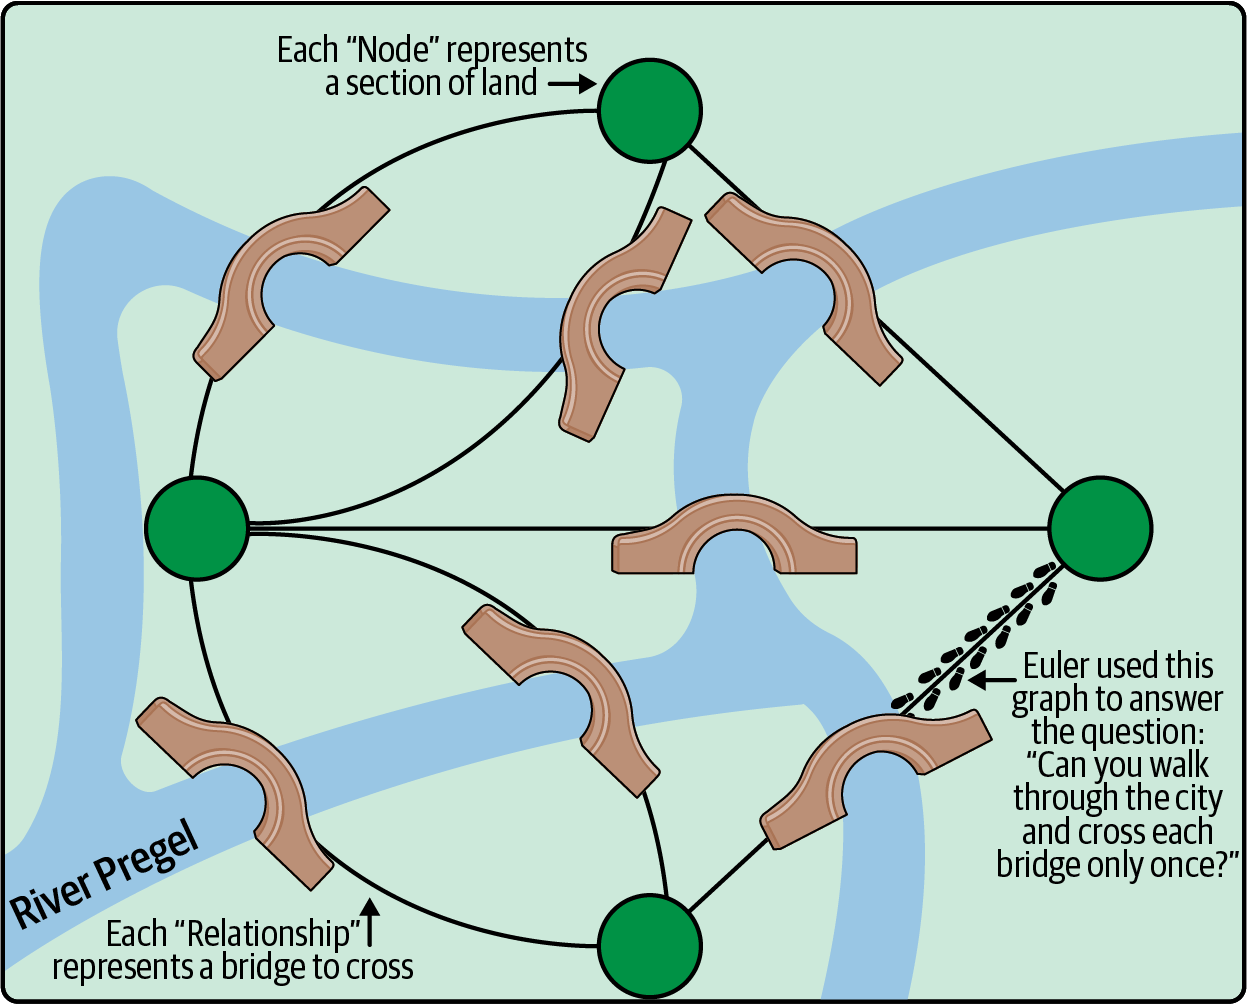
Graphs are not new.In fact, graph theory was invented by the Swiss mathematician Leonhard Euler in the 18th century.It was created to help compute the minimum distance that the emperor of Prussia had to walk to see the town of Knigsberg (modern-day Kaliningrad) by ensuring that each of its seven bridges was crossed only once, as shown in .
Font size:
Interval:
Bookmark:
Similar books «Knowledge Graphs»
Look at similar books to Knowledge Graphs. We have selected literature similar in name and meaning in the hope of providing readers with more options to find new, interesting, not yet read works.
Discussion, reviews of the book Knowledge Graphs and just readers' own opinions. Leave your comments, write what you think about the work, its meaning or the main characters. Specify what exactly you liked and what you didn't like, and why you think so.

