Froth!
Froth!
THE SCIENCE OF BEER
Mark Denny

2009 The Johns Hopkins University Press
All rights reserved. Published 2009
Printed in the United States of America on acid-free paper
2 4 6 8 9 7 5 3 1
The Johns Hopkins University Press
2715 North Charles Street
Baltimore, Maryland 21218-4363
www.press.jhu.edu
Library of Congress Cataloging-in-Publication Data
Denny, Mark, 1953
Froth! : the science of beer / Mark Denny.
p. cm.
Includes bibliographical references and index.
ISBN-13: 978-0-8018-9132-8 (hardcover : alk. paper)
ISBN-10: 0-8018-9132-9 (hardcover : alk. paper)
1. Beer. 2. Brewing. I. Title.
TP577.D476 2009
641.623dc 22 2008022646
A catalog record for this book is available from the British Library.
Special discounts are available for bulk purchases of this book. For more information,
please contact Special Sales at 410-516-6936 or specialsales@press.jhu.edu.
The Johns Hopkins University Press uses environmentally friendly book materials,
including recycled text paper that is composed of at least 30 percent post-consumer
waste, whenever possible. All of our book papers are acid-free, and our jackets and
covers are printed on paper with recycled content.
To friends from an earlier era
John Hewitt, who taught me how to drink beer;
John Hardy, who taught me how to make it;
and my University pals, who taught me why
Acknowledgments
When I first pitched the suggestion of a beer-and-physics book to the Johns Hopkins University Press Editor-in-Chief, Trevor Lipscombe, he provided much encouragement. Later, during the fermentation stage, I was helped significantly by Horst Dornbusch, who influences beer and beerocrats on two continents, and who obtained for me special permission to raid the photo archives of the Bavarian Brewers Federation. The book has been brought into top condition at JHUP by copy editor Carolyn Moser and art director Martha Sewall. I thank you all.
In recent months my homebrewing has benefited from the generosity of John Rowling, who let me loose in his garden to pick hops. Cheers, John.
Froth!
Introduction
There cant be good living where there is not good drinking.
Benjamin Franklin (17061790)
There cant be much amiss, tis clear,
to see the rate you drink your beer.
A. E. Housman (18591936)
Beer is the most popular alcoholic beverage in the world. Estimates of worldwide annual consumption vary from 114 to 132 billion liters. Think of a lake 2 miles across and 30 feet deep. Or, perhaps more apt, think of a giant beer glass half a mile high and a quarter mile across. I am talking about a lot of beer.
Before getting into the statistics a little more, I should tell you what this book is about. It may already have dawned on you that I am writing about beer, but there is more to my story than that. There are quite literally hundreds of books and Web sites about how to brew beer. Some of these are excellent (see the bibliography at the end of this book). Most fall into one of two categories, which I would characterize as How-To Plus a Lot of Recipes and Beta-Amylase Influence on Maltose Production from 2-Row Grain. The first category is self-explanatory and runs the gamut from excellent to awful.and seems to be written for professional brewers, academic researchers, or the geek end of the homebrew market. Both can provide interesting and useful information for the homebrewer, and some books (such as Wheelers Home Brewing) successfully combine elements of both categories. My book is unique, to the best of my knowledge, in that it unites brewing with accessible physics. You are not holding in your hands a recipe book or a Ph.D. thesis, but if you are interested in beer, and about how science and technology impact the production of your favorite tipple, then you will find much to engross you in the following pages.
Math analysis and beer tend not to go together in the literature. I am a physicist by training and a homebrewer by inclination. Inevitably I have, over the years, applied my knowledge of physics to the science of brewing. The results are, I believe, better brews and a better understanding of the brewing process. So, herein you will find out about beer and brewing in general, and about how to homebrew good beer, in particular. My science slant will be evident: math will occasionally be introduced, but the text is written so that, if you wish, you can glide over the equations without missing out on anything.
Mother Nature speaks mathematics, but most people dont, so I am well aware that the text should be stand-alone. Those of you who happen to be interested in the math as well as the beer (and in my experience most mathematicians, physicists, engineers, and science students are partial to both) will find that the technical aspects of brewing lend themselves well to mathematical analysis. More about all that later: here, I would like to return to the statistics of beer, after a necessary paragraph about units.
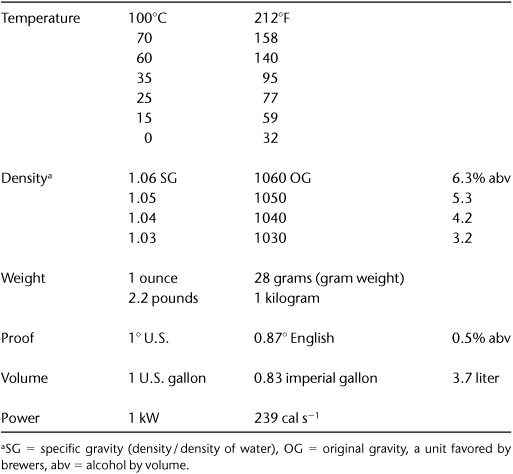
In and the different units used in the textto a minimum, leaving out, for example, some of the European units for alcohol content and some of the strange historical weights and measures, in particular the multitude of names for different bottles and barrels. Here is just one example to provide a flavor of the variety of beer and ale containers (wine is different): there are 54 imperial gallons in a hogshead, 36 in a barrel, 18 in a kilderkin, 9 in a firkin, and 41/2 in a pin. Of these units, only the barrel (abbreviated bbl) is widely used today in the brewing industry, though some retailers sell beer by the pin.
Table I.1 Conversion factors pertaining to beer
Now for some more of those telling statistics about beer. Per capita, the Czech people drain Beer Lake faster than any other nationality, as you can see from . There are perhaps a couple of surprises that emerge from these two graphs.
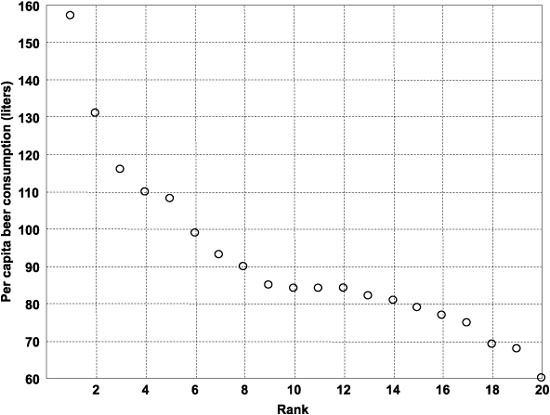
Figure I.1. Annual per capita beer consumption by nation: (1) Czech Republic,(2) Ireland, (3) Germany, (4) Australia, (5) Austria, (6) United Kingdom,(7) Belgium, (8) Denmark, (9) Finland, (10) Luxembourg, (11) Slovakia, (12) Spain,(13) USA, (14) Croatia, (15) the Netherlands, (16) New Zealand, (17) Hungary,(18) Poland, (19) Canada, (20) Portugal. Source: The Kirin Brewing Co.
The presence of Spain and Portugal in the top 20 for per capita beer consumption may raise an eyebrow or twoexcept in Spain and Portugal. We might expect wine to dominate in these southern European countries, but, it seems, the Iberians like their beer as well. In fact, given the hot summers in that part of the world, and the chilled lagers brewed in Spain and Portugal, we can readily understand the appeal of a cool brew (ditto Australia, Mexico, and the United States).
The city which claims the greatest per capita consumption of beer is Darwin, in northern Australia. Here, a sweltering climate, a long tradition of beer drinking, and a macho culture combine to produce a beer consumption rate of 504 pints (233 liters) per person per year. That is about equal to 10 U.S. pints per week, for every man, woman, and child. Gulp.


