I. M. Gelfand - Functions and Graphs
Here you can read online I. M. Gelfand - Functions and Graphs full text of the book (entire story) in english for free. Download pdf and epub, get meaning, cover and reviews about this ebook. year: 2002, publisher: Dover Publications, genre: Children. Description of the work, (preface) as well as reviews are available. Best literature library LitArk.com created for fans of good reading and offers a wide selection of genres:
Romance novel
Science fiction
Adventure
Detective
Science
History
Home and family
Prose
Art
Politics
Computer
Non-fiction
Religion
Business
Children
Humor
Choose a favorite category and find really read worthwhile books. Enjoy immersion in the world of imagination, feel the emotions of the characters or learn something new for yourself, make an fascinating discovery.
- Book:Functions and Graphs
- Author:
- Publisher:Dover Publications
- Genre:
- Year:2002
- Rating:5 / 5
- Favourites:Add to favourites
- Your mark:
Functions and Graphs: summary, description and annotation
We offer to read an annotation, description, summary or preface (depends on what the author of the book "Functions and Graphs" wrote himself). If you haven't found the necessary information about the book — write in the comments, we will try to find it.
I. M. Gelfand: author's other books
Who wrote Functions and Graphs? Find out the surname, the name of the author of the book and a list of all author's works by series.


Functions and Graphs — read online for free the complete book (whole text) full work
Below is the text of the book, divided by pages. System saving the place of the last page read, allows you to conveniently read the book "Functions and Graphs" online for free, without having to search again every time where you left off. Put a bookmark, and you can go to the page where you finished reading at any time.
Font size:
Interval:
Bookmark:

FUNCTIONS AND GRAPHS
I. M. Gelfand, E. G. Glagoleva,
& E. E. Shnol
Translated and adapted by
Thomas Walsh and Randell Magee
from the second Russian edition
DOVER PUBLICATIONS, INC.
Mineola, New York
Copyright
Copyright 1969 by The University of Chicago
All rights reserved.
Bibliographical Note
This edition, published in 2002 by Dover Publications, Inc. (by special arrangement with The M.I.T. Press, Cambridge, Massachusetts), is an unabridged republication of Functions and Graphs (Vol. 2, Library of School Mathematics), published by The M.I.T. Press in 1969.
Library of Congress Cataloging-in-Publication Data
Gelfand, I. M. (Izrail Moiseevich)
[Funktsii i grafiki. English]
Functions and graphs / I.M. Gelfand, E.G. Glagoleva & E.E. Shnol; translated and adapted by Thomas Walsh and Randell Magee from the second Russian ed.Dover ed.
p. cm.
Reprint ed. :Functions and graphs (vol. 2, Library of School Mathematics), pub. by M.I.T. Press, in 1969.
ISBN-13: 978-0-486-42564-1 (pbk.)
ISBN-10: 0-486-42564-9 (pbk.)
1. Functions. 2. Graphic methods. I. Glagoleva, E. G. (Elena Georgievna) II. Shnol, E. E. (Emmanuil Elevich) III. Title.
QA331 .G3613 2002
515dc21
2002067591
Manufactured in the United States by Courier Corporation
42564904
www.doverpublications.com
Foreword
The second volume of the mathematical series of the Library of School Mathematics consists of two booklets under the general heading Functions and Graphs. This (first) booklet is devoted to the analysis of fundamental methods of constructing graphs by considering very simple functions. In the second booklet more complicated and refined questions will be dealt with. The book is intended for ninth-grade students.
Learning how to construct graphs by using a book is not easy: the reader does not have the benefit of a blackboard on which a teacher constructs a graph during a lesson or a lecture. Therefore the authors abandoned the usual diagrams in which only the final form of the graph is shown, and asked the illustrators of the volume, V. B. Yankilevskii and V. V. Smolyaninov, to transform the margins in the booklet into something like a blackboard.
Following the diagrams in the margins, the reader will find it easy to reproduce step by step the whole construction of a graph.
Part of the theoretical material is stated in the form of problems. To understand the text it is necessary to examine closely all the problems and examples contained in the text.
While preparing the book, the authors profited by the help and advice of their colleagues: V. M. Alekseev, V. I. Keilis-Borok, A. A. Kirillov, I. Kh. Sivashinskii, S. V. Fomin, and M. L. Tsetlin. The authors wish to thank them for their help. The authors are particularly grateful to the editor of the volume, B. V. Shabat, whose work significantly improved the text.
The second edition contains a new chapter on power functions as well as some problems and diagrams.
The authors wish to thank the students of the Mathematics Correspondence School of Moscow State University who sent in their comments on the book as well as N. B. Vasiliev and V. L. Gutenmakher who helped greatly in the preparation of the second edition.
The Authors
Translators note: The second booklet has not yet been published in the U.S.S.R. When it appears, it will be translated and published in the present series.
Contents
Introduction
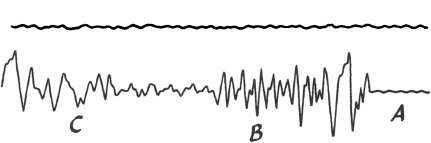
Fig. 1
In the reader can see two curves traced by a seismograph, an instrument which registers fluctuations of the earths crust. The upper curve was obtained while the earths crust was undisturbed, the lower shows the signals of an earthquake.
In there are two cardiograms. The upper shows normal heartbeat. The lower is taken from a heart patient.
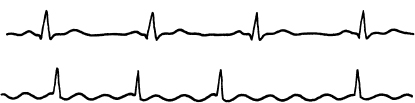
Fig. 2
shows the so-called characteristic of a semiconducting element, that is, the curve displaying the relationship between current intensity and voltage.
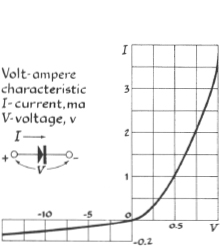
Fig. 3
In analyzing a seismogram, the seismologist finds out when and where an earthquake occurred and determines the intensity and character of the shocks. The physician examining a patient can, with the help of a cardiogram, judge the disturbances in heart activity; a study of the cardiogram helps to diagnose a disease correctly. The characteristic curve of a semiconducting element enables the radio-electrical engineer to choose the most favorable condition for his work.
All of these people study certain functions by the graphs of these functions.
What, then, is a function, and what is the graph of a function ?
Before giving a precise definition of a function, let us talk a little about this concept. Descriptively speaking, a function is given when to each value of some quantity, which mathematicians call the argument and usually denote by the letter x, there corresponds the value of another quantity y, called the function.
Thus, for example, the magnitude of the displacement of the earths surface during an earthquake has a definite value at each instant of time; that is, the amount of displacement is a function of time. The current intensity in a semiconducting element is a function of voltage, since to each value of the voltage there corresponds a definite value of current intensity.
Many such examples can be mentioned: the volume of a sphere is a function of its radius, the altitude to which a stone rises when thrown vertically upward is a function of its initial speed, and so on.
Let us now pass to the precise definitions. To say that the quantity y is a function of the quantity one first of all specifies which values x: can take. These allowed values of the argument x are called admissible values, and the set of all admissible values of the quantity or variable x is called the domain of definition of the function y.
For instance, if we say that the volume V of the sphere is a function of its radius R, then the domain of definition of the function  will be all numbers greater than zero, since the value R of the radius of the sphere can be only a positive number.
Whenever a function is given, it is necessary to specify its domain of definition.
Definition I
We say that y is a function of the variable x, if: (1) it is specified which values of x are admissible, i.e., the domain of definition of the function is given, and (2) to each admissible value of x there corresponds exactly one value of the variable y.
Instead of writing the variable y is a function of the variable x, one writes

(Read: y is equal to f of x.)
The notation f(a) denotes the numerical value of the function
Font size:
Interval:
Bookmark:
Similar books «Functions and Graphs»
Look at similar books to Functions and Graphs. We have selected literature similar in name and meaning in the hope of providing readers with more options to find new, interesting, not yet read works.
Discussion, reviews of the book Functions and Graphs and just readers' own opinions. Leave your comments, write what you think about the work, its meaning or the main characters. Specify what exactly you liked and what you didn't like, and why you think so.