Table of Contents
Tableau Public & Tableau Desktop
Most of the examples illustrated here can be followed along with Tableau Public. Cases requiring Tableau Desktop are highlighted.
1.1 Why visualize data ?
Over the past few decades, Excel has become the de facto data analytics tool for most business users. When you need to sum two values, it couldnt be simpler than clicking on the first value that you need to add, follow it up with a "+" sign and the next value to be added. Voil, youve got yourself the total of two values. Drag the formula down by clicking on the corners, youve got yourself a sum of 2 columns.
Unfortunately this flexibility comes at a cost. The user gets gradually trapped in the world of quick fixes and patched formulae that Excel has to offer. Initially Lotus 123, the predecessor of Excel was conceived primarily as a data entry tool and indeed Excel "excels" at this task.
But now in this new era of big data, data visualization and data analytics deserve their own tool-kit. The human brain does a very poor job deciphering meaningful trends from a table of raw data (numbers) but at the same time excels at comparing, extrapolating and spotting trends in visual shapes and colors. It turns out the brain is able to take in a picture and process it in one stroke while on the other hand processes text in a linear fashion. Imagine, a bar chart which condenses 100 rows of data into a few columns against reading the rows one by one. You start to get the picture. Having said that, its the responsibility of the analyst to effectively distill and convey the meaning hidden behind the numbers through effective and meaningful visualizations.
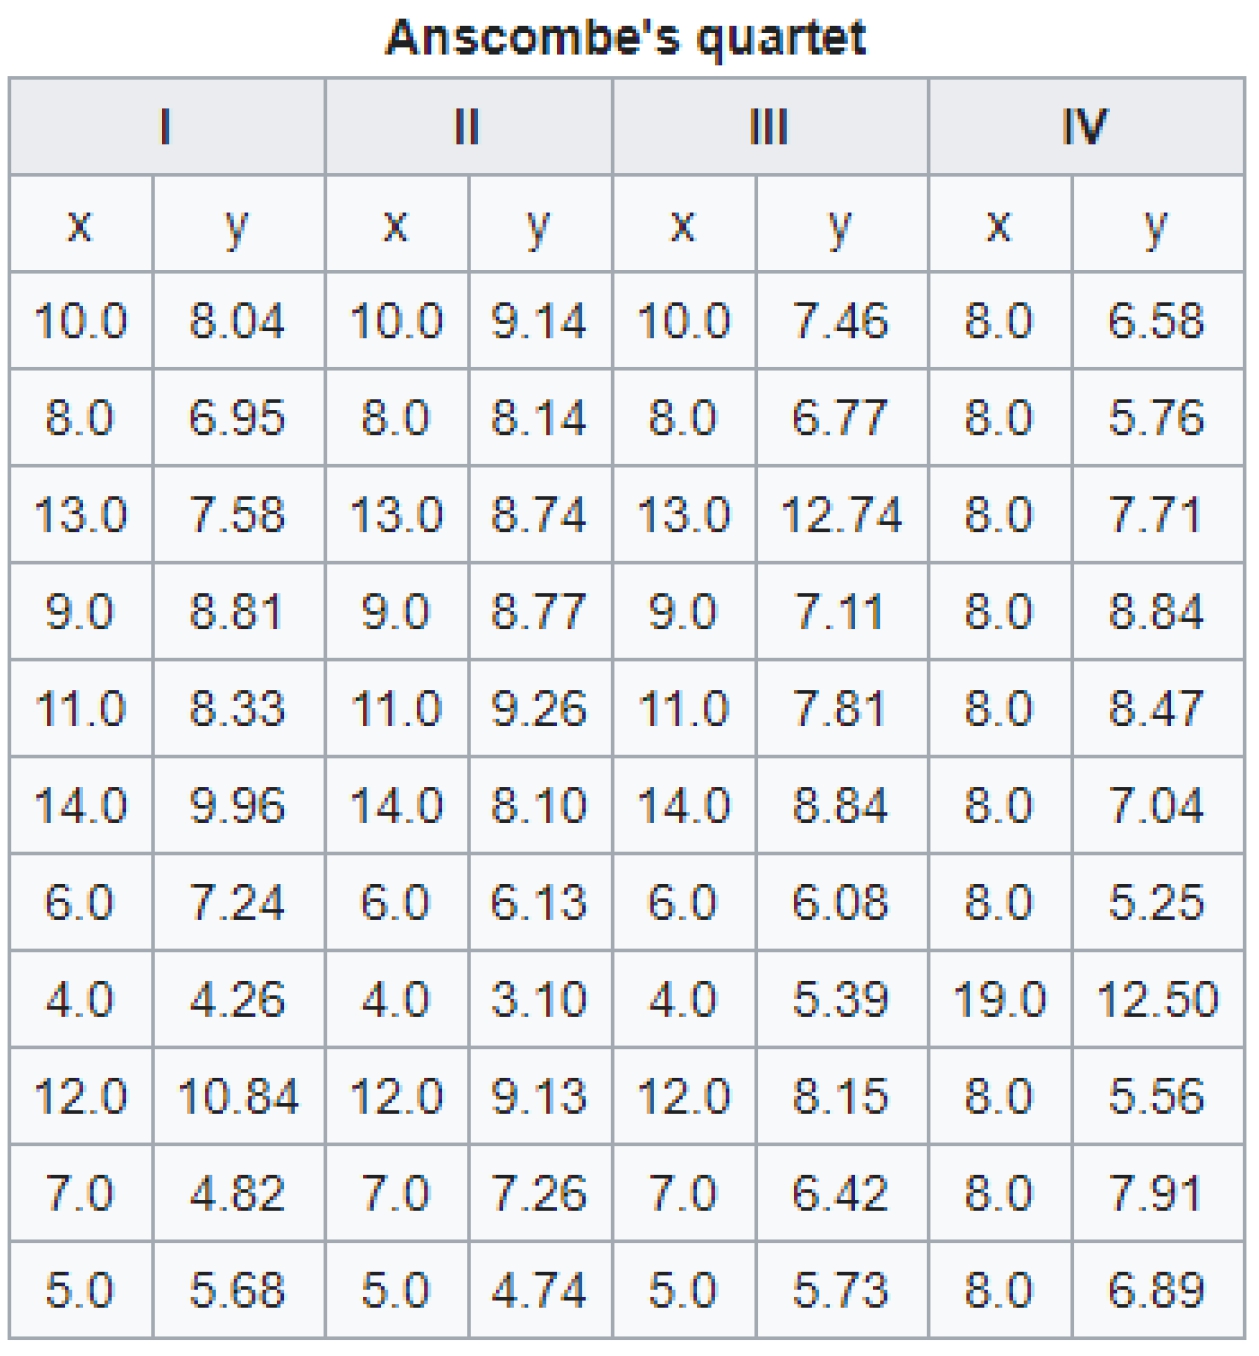
If you take a close look at the following table of raw numbers, youll be able to make a few observations.
- There are four datasets
- Each dataset has an x and y column
- Numbers seem to range from 4 to 13
- There are atmost 2 decimals
Figure 1: Anscombes dataset
And we start squeezing our eyelids together to squeeze out more information from this table. The more astute among you, might have copy, pasted these numbers into a good ol excel sheet and grabbed your "Im a data scientist" coffee mug. You start making a list
- Average of x: 9
- Sample variance of x: 11
- Average of y: 7.5
- Sample variance of x: 4.125
- Correlation between x and y: 0.816
- A nice linear regression line: y = 3 + 0.5x
- R of the linear regression line: 0.67
Thats a lot of numbers and now the strange thing that you notice is that this above list is the same across all the 4 datasets. Its fairly easy to make simplistic reductions about the distributions of x and y that they are similar based on the summary statistics. A quick visualization would instantly reveal the hidden gems in the distributions. This example also helps underline the importance of exploratory data analytics before drawing any inferences and conclusions.
Figure 2: Anscombes dataset in Tableau
Having said that, Im definitely not discouraging the use of Excel in any way. Its a powerful tool in the repertoire of any competent professional. The main point I want to drive home is the fact that Excel often needs to be complemented by a data visualization tool to help effectively communicate and share your findings. Microsoft PowerBI is just a good tool as Tableau but this book being about Tableau, Ill contain myself to illustrations with Tableau.
1.2 Who is this book for ?
The primary intended audience of this book are Business analysts, Data Analysts and Financial Analysts or more broadly anyone who is hitting the limits of Excel with their data analytics needs. If your day to day revolves around staring at numbers all day long, then youre definitely part of the target audience. There are no prerequisites to follow along the concepts in this book. We will work our way gradually from the very fundamentals of data all the way up to to building fancy dashboards & visualizations on gigabytes of data.
1.3 How is this book different ?
There are many books on the market which are excellent Tableau user guides and reference manuals. They do an excellent job of presenting every menu tab, button, pane and shelf in Tableau. If youre the kind of person who needs to know every single button and functionality tucked into Tableau then this might not be the right book for you.
When you start to learn a new language and want to go about it in a systematic and methodical way, you would start with the grammar. Understanding the foundational underpinnings of the languages, helps you get the basics right and then its a matter of stringing words together to make sentences. Lining up words within the rules defined by the grammar (or not) in infinite possible ways, to write Shakespearean poetry or tabloid articles or have conversations, is a logical next step.
This book intends to approach the subject of mastering Tableau in a similar fashion. Well try to distill the very core essence of Tableau in a few concepts and then its just a matter of combining them in infinite possible ways to build the required data visualizations.
Icons used in this book

Tips & shortcuts worth keeping in mind

Traps to watch out for in Tableau which could help you avoid potential headaches down the road.

Technical details which are not necessary to follow along the chapters in this book and can be comfortably skipped or glossed over.
1.4 How to contact us
Please address comments and questions concerning this book to:
Please feel free to reach out if you need any help on your data analytics projects at: .
1.5 Acknowledgements
2.1 Installation of Tableau
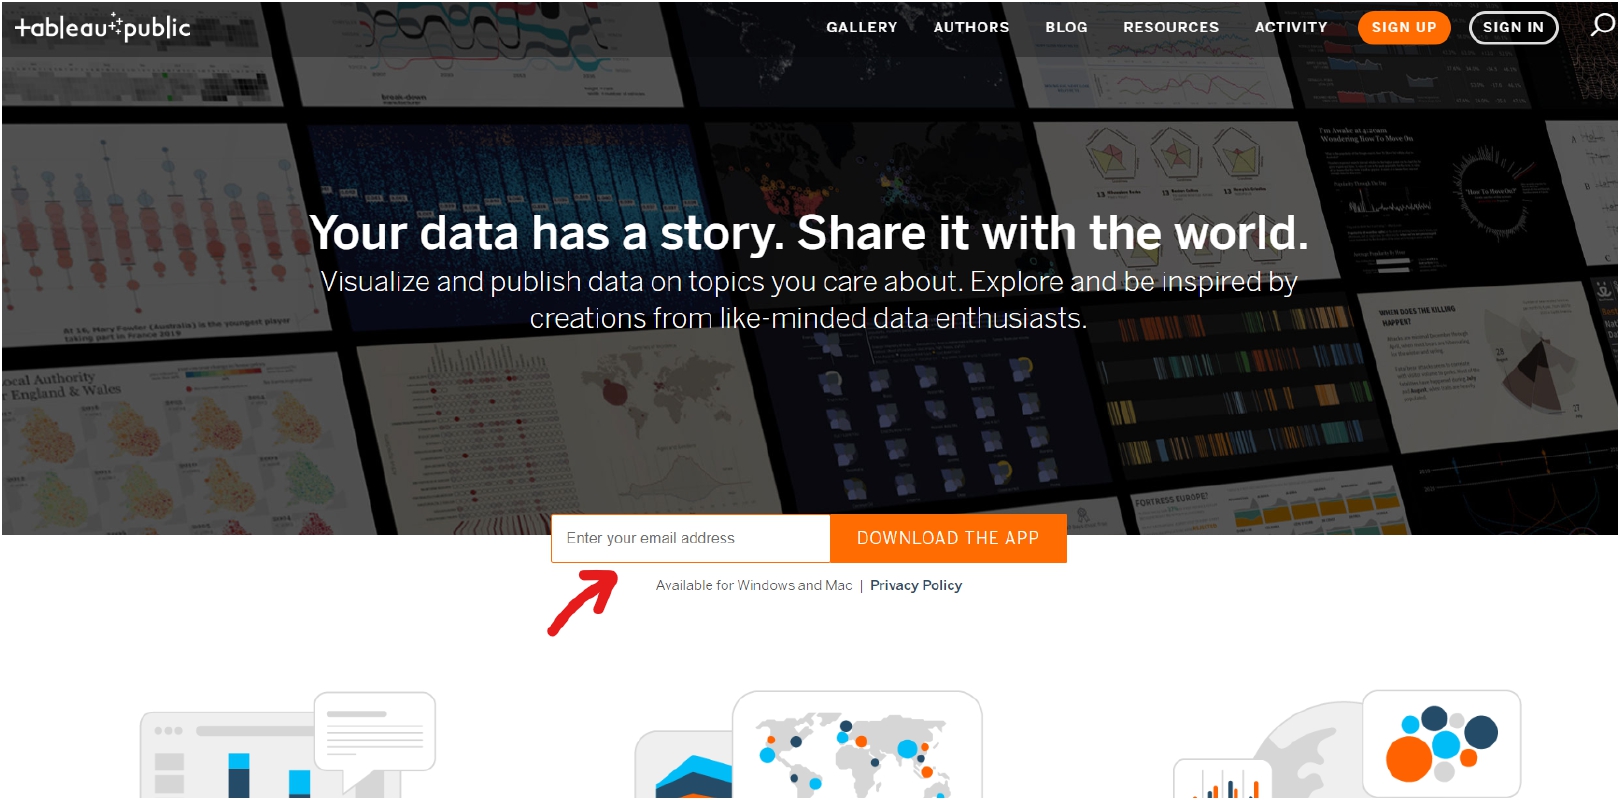
Well gloss over very quickly the installation of Tableau public which you will require to follow along with this book. Unfortunately for the corner cases, business users working on Macs and Linux, Ill have to redirect your questions and concerns to the almighty Google. Head over to Tableau publics site. Hand over your email, as usual, in return for the Tableau public installation file (.exe).
Figure 3: Tableau public download page
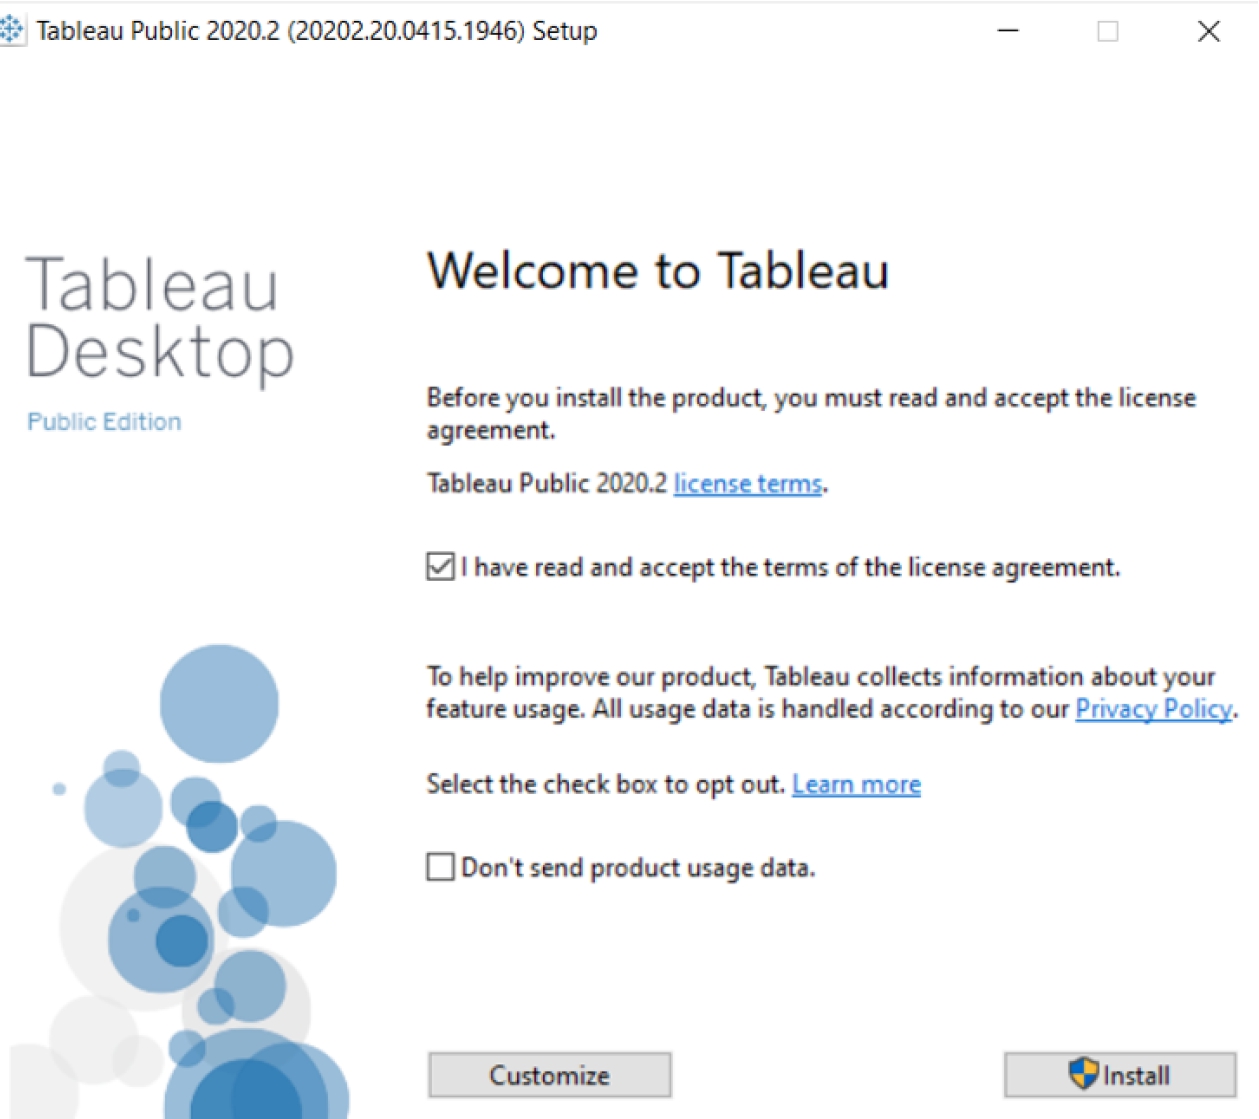
Double click on the .exe and follow along the instructions to complete the installation of Tableau Public.
Figure 4: Tableau public download page






![Jones - Communicating data with Tableau : [designing, developing, and delivering data visualizations; covers Tableau version 8.1]](/uploads/posts/book/108879/thumbs/jones-communicating-data-with-tableau.jpg)


 Tips & shortcuts worth keeping in mind
 Traps to watch out for in Tableau which could help you avoid potential headaches down the road.
 Technical details which are not necessary to follow along the chapters in this book and can be comfortably skipped or glossed over.