• Complain

Shankar Arul - Tableau for Business Users: Learn to Automate and Simplify Dashboards for Better Decision Making

Here you can read online Shankar Arul - Tableau for Business Users: Learn to Automate and Simplify Dashboards for Better Decision Making full text of the book (entire story) in english for free. Download pdf and epub, get meaning, cover and reviews about this ebook. year: 2021, publisher: Apress, genre: Computer. Description of the work, (preface) as well as reviews are available. Best literature library LitArk.com created for fans of good reading and offers a wide selection of genres:

Romance novel Science fiction Adventure Detective Science History Home and family Prose Art Politics Computer Non-fiction Religion Business Children Humor

Choose a favorite category and find really read worthwhile books. Enjoy immersion in the world of imagination, feel the emotions of the characters or learn something new for yourself, make an fascinating discovery.

Shankar Arul Tableau for Business Users: Learn to Automate and Simplify Dashboards for Better Decision Making
  • Book:
    Tableau for Business Users: Learn to Automate and Simplify Dashboards for Better Decision Making
  • Author:
  • Publisher:
    Apress
  • Genre:
  • Year:
    2021
  • Rating:
    5 / 5
  • Favourites:
    Add to favourites
  • Your mark:
    • 100
    • 1
    • 2
    • 3
    • 4
    • 5

Tableau for Business Users: Learn to Automate and Simplify Dashboards for Better Decision Making: summary, description and annotation

We offer to read an annotation, description, summary or preface (depends on what the author of the book "Tableau for Business Users: Learn to Automate and Simplify Dashboards for Better Decision Making" wrote himself). If you haven't found the necessary information about the book — write in the comments, we will try to find it.

Learn Tableau by working through concrete examples and issues that you are likely to face in your day-to-day work.

Author Shankar Arul starts by teaching you the fundamentals of data analytics before moving on to the core concepts of Tableau. You will learn how to create calculated fields, and about the currently available calculation functionalities in Tableau, including Basic Expressions, Level of Detail (LOD) Expressions, and Table Calculations. As the book progresses, youll be walked through comparisons and trend calculations using tables. A concluding chapter on dashboarding will show you how to build actionable dashboards to communicate analysis and visualizations. Youll also see how Tableau can complement and communicate with Excel.

After completing this book, you will be ready to tackle the challenges of data analytics using Tableau without getting bogged down by the technicalities of the tool.

What Will You Learn

    Master the core concepts of Tableau
  • Automate and simplify dashboards to help business users
  • Understand the basics of data visualization techniques
  • Leverage powerful features such as parameters, table calculations, level of detail expressions, and more

Who is This book For

Business analysts, data analysts, as well as financial analysts.

Shankar Arul: author's other books


Who wrote Tableau for Business Users: Learn to Automate and Simplify Dashboards for Better Decision Making? Find out the surname, the name of the author of the book and a list of all author's works by series.

Tableau for Business Users: Learn to Automate and Simplify Dashboards for Better Decision Making — read online for free the complete book (whole text) full work

Below is the text of the book, divided by pages. System saving the place of the last page read, allows you to conveniently read the book "Tableau for Business Users: Learn to Automate and Simplify Dashboards for Better Decision Making" online for free, without having to search again every time where you left off. Put a bookmark, and you can go to the page where you finished reading at any time.

Light

Font size:

Reset

Interval:

Bookmark:

Make
Contents
Landmarks
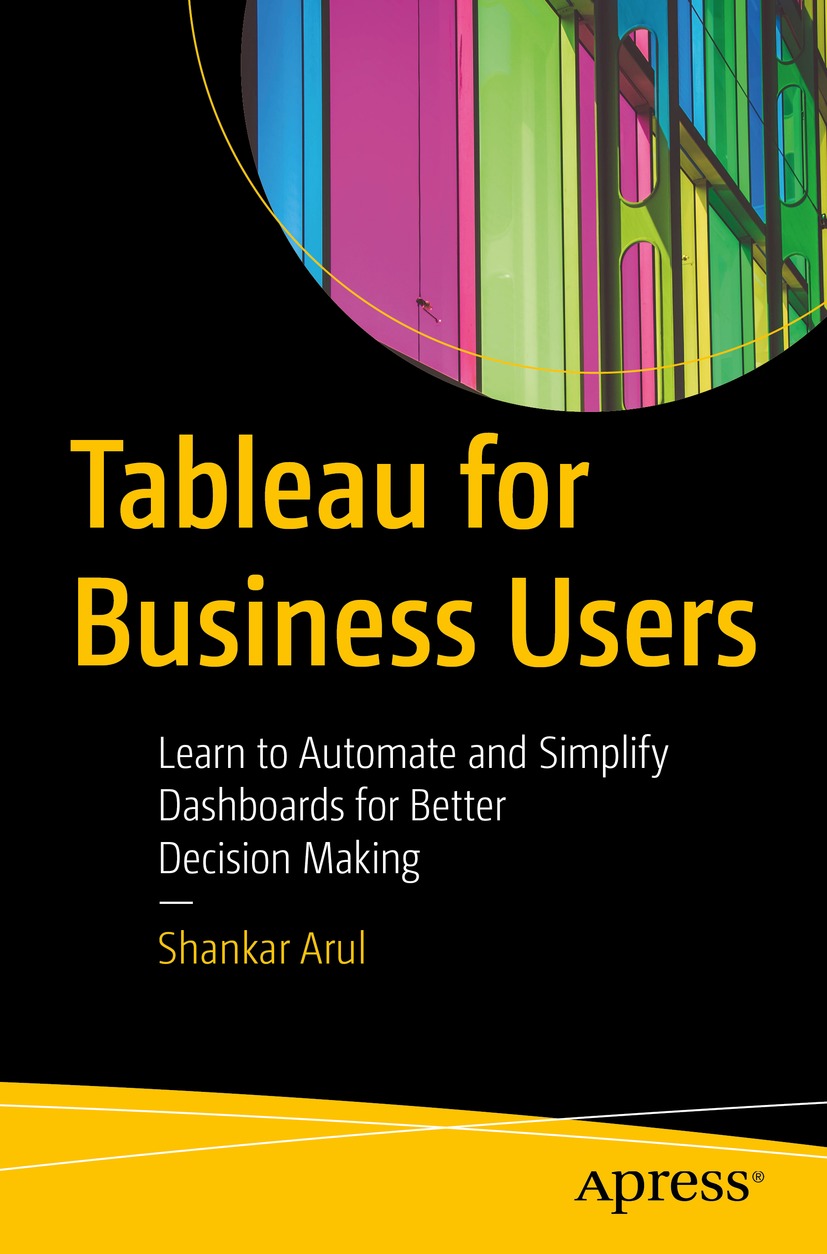
Book cover of Tableau for Business Users Shankar Arul Tableau for - photo 1
Book cover of Tableau for Business Users
Shankar Arul
Tableau for Business Users
Learn to Automate and Simplify Dashboards for Better Decision Making
1st ed.
Logo of the publisher Shankar Arul Montreuil France ISBN - photo 2
Logo of the publisher
Shankar Arul
Montreuil, France
ISBN 978-1-4842-7785-0 e-ISBN 978-1-4842-7786-7
https://doi.org/10.1007/978-1-4842-7786-7
Shankar Arul 2022
This work is subject to copyright. All rights are solely and exclusively licensed by the Publisher, whether the whole or part of the material is concerned, specifically the rights of translation, reprinting, reuse of illustrations, recitation, broadcasting, reproduction on microfilms or in any other physical way, and transmission or information storage and retrieval, electronic adaptation, computer software, or by similar or dissimilar methodology now known or hereafter developed.
The use of general descriptive names, registered names, trademarks, service marks, etc. in this publication does not imply, even in the absence of a specific statement, that such names are exempt from the relevant protective laws and regulations and therefore free for general use.
The publisher, the authors and the editors are safe to assume that the advice and information in this book are believed to be true and accurate at the date of publication. Neither the publisher nor the authors or the editors give a warranty, expressed or implied, with respect to the material contained herein or for any errors or omissions that may have been made. The publisher remains neutral with regard to jurisdictional claims in published maps and institutional affiliations.

This Apress imprint is published by the registered company APress Media, LLC part of Springer Nature.

The registered company address is: 1 New York Plaza, New York, NY 10004, U.S.A.

Testimonial

In the age of big data, small businesses and large corporations need to rely on data analytics for their day-to-day decisions and strategic orientations. This book provides an easy approach to quickly master data visualization using Tableau, allowing you to make clear and efficient choices.

Ait Voncke, CEO, Aviv Group

Introduction

My goal with this book is to help business users learn how to use Tableau for data analytics and visualization. Business users have plenty of questions to answer to run their business effectively. Unfortunately, they do not possess the right tools or the skillset to query the data which holds the answers to these questions. Tableau for Business Users is geared towards data novice business users and will help you master Tableau by walking you through concrete examples and issues that you might face in your day-to-day work.

Over the course of the book, Ill also distill the core of Tableau into a few concepts. From there, its just a matter of combining them in many different ways to build whatever data visualizations and analyses you need. Starting from the fundamentals of data, this book gently builds up the pace by introducing you to the crux of Tableau, the subtleties of authoring calculated fields, and Tableau calculations, all the way up to advanced functionalities such as level of detail calculations. I bring everything together in a chapter on dashboarding, helping you build actionable dashboards to effectively communicate your analysis and visualizations.

Data-driven decision-making is no longer a nice to have in todays context, but an absolute must. This book will prepare you to tackle the challenges of big data and data analytics by helping you to master Tableau without getting bogged down in the technicalities of the tool. Excel , which is the go-to tool for any competent business professional, needs to be complemented by a data visualization tool such as Tableau to help effectively communicate and share your findings. This book will help you in this transition to the era of big data.

Any source code or other supplementary material referenced by the author in this book is available to readers on GitHub via the books product page, located at www.apress.com/9781484277850. For more detailed information, please visit http://www.apress.com/source-code.

Acknowledgments

As always, I would like to thank my parents, who enabled me to write this book in the first place, and my wife, who supports me in all my endeavors. I would also like to make a special dedication to my kids Nikie and Brooklyn, who show me the joy of life every day. Special thanks to Santosh Arul for his help with Photoshop. You can reach him at sarul.design@gmail.com for your Photoshop and Illustrator design needs.

Table of Contents
About the Author
Shankar Arul
has a masters degree in industrial engineering from Virginia Tech and an MBA in - photo 3
has a masters degree in industrial engineering from Virginia Tech and an MBA in finance from ESSEC Business School in France. He has more than 15 years of hands-on experience in data visualization and data science. Having faced the frustrations of business users with data-driven decision-making in companies like BNP, Apple, Groupon, and Kering, he decided to enable business users with the power of data visualization and Tableau through this book.
About the Technical Reviewer
Ashwini Potdar
is a senior Tableau developer at Onit engaged in developing maintaining and - photo 4
is a senior Tableau developer at Onit, engaged in developing, maintaining and managing pre-packaged and custom BI systems on Tableau software for multiple law and consulting firms. With 7 plus years of experience working in various domains, she brings immense value to the table by turning raw, unorganized and huge data sets into actionable information.
The Author(s), under exclusive license to APress Media, LLC, part of Springer Nature 2022
S. Arul Tableau for Business Users https://doi.org/10.1007/978-1-4842-7786-7_1
1. Why Visualize Data?
Shankar Arul
(1)
Montreuil, France

Over the past few decades, Microsoft Excel has become the de facto data analytics tool for most business users. When you need the sum of two values, it couldnt be simpler than clicking the first value you need to add, following it up with a + sign, and adding the next value. Voil! You have a total of two values. Drag the formula down by clicking the corners. Youve got a sum of two columns.

Unfortunately, this flexibility comes at a cost. The user gets gradually trapped in the world of quick fixes and patched formulas that Excel offers. Initially, Lotus 123, the predecessor of Excel, was conceived primarily as a data entry tool, and indeed, Excel excels at this task.

But now, in this new era of big data , data visualization and data analytics require their own toolkit. The human brain does a very poor job deciphering meaningful trends from a table of raw data (numbers), but at the same time excels at comparing, extrapolating, and spotting trends in visual shapes and colors. It turns out the brain can take in a picture and process it in one stroke while linearly processing text. Imagine a bar chart that condenses 100 rows of data into a few columns against reading the rows one by one. You start to get the picture. Its the responsibility of the analyst to effectively distill and convey the meaning hidden behind the numbers through effective and meaningful visualizations.

Next page
Light

Font size:

Reset

Interval:

Bookmark:

Make

Similar books «Tableau for Business Users: Learn to Automate and Simplify Dashboards for Better Decision Making»

Look at similar books to Tableau for Business Users: Learn to Automate and Simplify Dashboards for Better Decision Making. We have selected literature similar in name and meaning in the hope of providing readers with more options to find new, interesting, not yet read works.


Reviews about «Tableau for Business Users: Learn to Automate and Simplify Dashboards for Better Decision Making»

Discussion, reviews of the book Tableau for Business Users: Learn to Automate and Simplify Dashboards for Better Decision Making and just readers' own opinions. Leave your comments, write what you think about the work, its meaning or the main characters. Specify what exactly you liked and what you didn't like, and why you think so.