• Complain

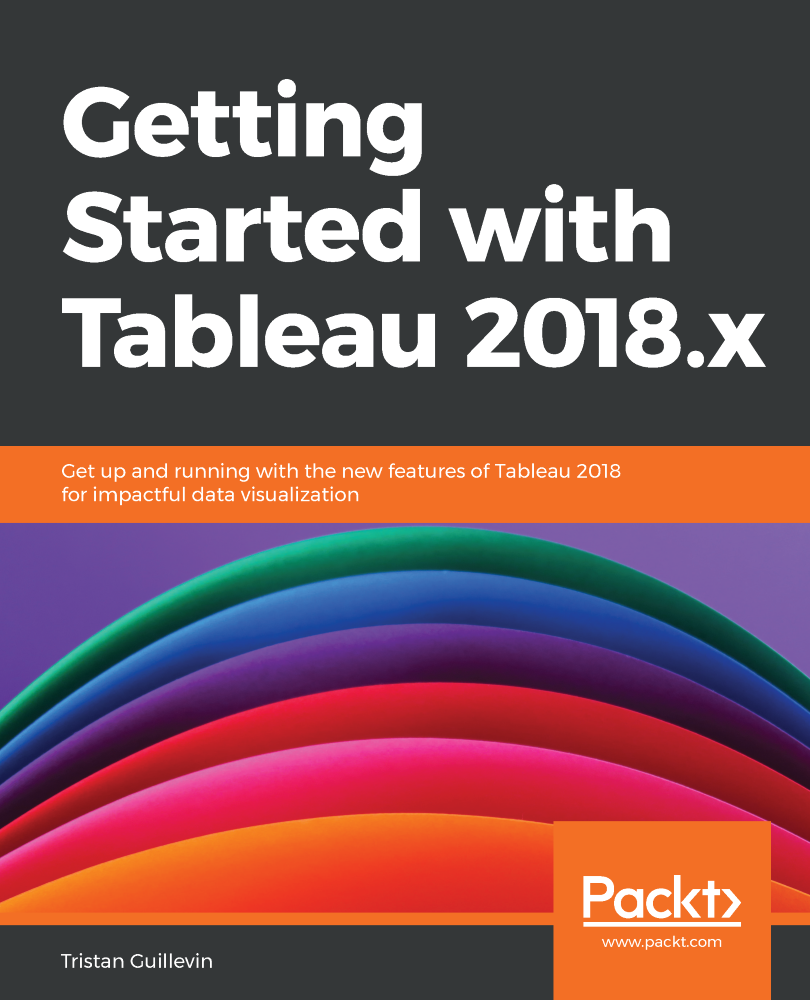
Tristan Guillevin - Getting Started with Tableau 2018.x: Get up and running with the new features of Tableau 2018 for impactful data visualization

Here you can read online Tristan Guillevin - Getting Started with Tableau 2018.x: Get up and running with the new features of Tableau 2018 for impactful data visualization full text of the book (entire story) in english for free. Download pdf and epub, get meaning, cover and reviews about this ebook. year: 2018, publisher: Packt Publishing, genre: Computer. Description of the work, (preface) as well as reviews are available. Best literature library LitArk.com created for fans of good reading and offers a wide selection of genres:

Romance novel Science fiction Adventure Detective Science History Home and family Prose Art Politics Computer Non-fiction Religion Business Children Humor

Choose a favorite category and find really read worthwhile books. Enjoy immersion in the world of imagination, feel the emotions of the characters or learn something new for yourself, make an fascinating discovery.

No cover
  • Book:
    Getting Started with Tableau 2018.x: Get up and running with the new features of Tableau 2018 for impactful data visualization
  • Author:
  • Publisher:
    Packt Publishing
  • Genre:
  • Year:
    2018
  • Rating:
    5 / 5
  • Favourites:
    Add to favourites
  • Your mark:
    • 100
    • 1
    • 2
    • 3
    • 4
    • 5

Getting Started with Tableau 2018.x: Get up and running with the new features of Tableau 2018 for impactful data visualization: summary, description and annotation

We offer to read an annotation, description, summary or preface (depends on what the author of the book "Getting Started with Tableau 2018.x: Get up and running with the new features of Tableau 2018 for impactful data visualization" wrote himself). If you haven't found the necessary information about the book — write in the comments, we will try to find it.

Leverage the power of Tableau to get actionable business insights and make better business decisions

Key Features
  • Explore all the new features of Tableau 2018.x
  • Begin your Tableau journey by understanding its core functionalities
  • Apply advanced techniques such as data blending and parameters to make the best of Tableau
  • Book Description

    Tableau is one of the leading business intelligence tools used worldwide, in organizations of every scale. In its latest release, Tableau 2018 promises richer and more useful features related to visual analytics, reporting, dashboarding, and a host of other data visualization aspects. Getting Started with Tableau 2018.x will get you up and running with these features.

    The book starts with all the new functionalities of the different Tableau 2018 versions, along with concrete examples of how to use them. However, if youre new to Tableau, dont worry! The rest of the book will guide you through each major aspect of Tableau with examples. Youll learn how to connect to data, build a data source, visualize your data, build a dashboard, and share it online. In the final chapters, youll also learn advanced techniques such as creating a cross-database join, data blending, and more.

    By the end of the book, you will have a firm understanding of how to effectively use Tableau to create quick, cost-effective, and business-efficient business intelligence solutions.

    What you will learn
  • Discover new functionalities such as density, extensions, and transparency introduced in Tableau 2018.x
  • Connect tables and make transformations such as pivoting the field and splitting columns
  • Build an efficient data source for your analysis
  • Design insightful data visualization using different mark types and properties
  • Build powerful dashboards and stories
  • Share your work and interact with Tableau Server
  • Use Tableau to explore your data and find new insights
  • Explore Tableaus advanced features and gear up for upcoming challenges
  • Who this book is for

    If you're a beginner or an existing BI professional looking to get the most out of Tableau 2018s latest features, this book is for you. You'll also find this book useful if you're an aspiring analyst who wants to learn the capabilities of Tableau to answer business-specific questions. No prior knowledge or experience with Tableau or any other Business Intelligence tool is necessary.

    Tristan Guillevin: author's other books


    Who wrote Getting Started with Tableau 2018.x: Get up and running with the new features of Tableau 2018 for impactful data visualization? Find out the surname, the name of the author of the book and a list of all author's works by series.

    Getting Started with Tableau 2018.x: Get up and running with the new features of Tableau 2018 for impactful data visualization — read online for free the complete book (whole text) full work

    Below is the text of the book, divided by pages. System saving the place of the last page read, allows you to conveniently read the book "Getting Started with Tableau 2018.x: Get up and running with the new features of Tableau 2018 for impactful data visualization" online for free, without having to search again every time where you left off. Put a bookmark, and you can go to the page where you finished reading at any time.

    Light

    Font size:

    Reset

    Interval:

    Bookmark:

    Make
    Getting Started with Tableau 2018x Get up and running with the new - photo 1
    Getting Started with
    Tableau 2018.x


    Get up and running with the new features of Tableau 2018 for impactful data visualization
    Tristan Guillevin

    BIRMINGHAM - MUMBAI Getting Started with Tableau 2018x Copyright 2018 Packt - photo 2

    BIRMINGHAM - MUMBAI
    Getting Started with Tableau 2018.x

    Copyright 2018 Packt Publishing

    All rights reserved. No part of this book may be reproduced, stored in a retrieval system, or transmitted in any form or by any means, without the prior written permission of the publisher, except in the case of brief quotations embedded in critical articles or reviews.

    Every effort has been made in the preparation of this book to ensure the accuracy of the information presented. However, the information contained in this book is sold without warranty, either express or implied. Neither the author, nor Packt Publishing or its dealers and distributors, will be held liable for any damages caused or alleged to have been caused directly or indirectly by this book.

    Packt Publishing has endeavored to provide trademark information about all of the companies and products mentioned in this book by the appropriate use of capitals. However, Packt Publishing cannot guarantee the accuracy of this information.

    Commissioning Editor: Amey Varangaonkar
    Acquisition Editor: Divya Poojari
    Content Development Editor: Snehal Kolte
    Technical Editor: Sayli Nikalje
    Copy Editor: Safis Editing
    Project Coordinator: Manthan Patel
    Proofreader: Safis Editing
    Indexer: Aishwarya Gangawane
    Graphics: Jisha Chirayil
    Production Coordinator: Shantanu Zagade

    First published: September 2018

    Production reference: 1280918

    Published by Packt Publishing Ltd.
    Livery Place
    35 Livery Street
    Birmingham
    B3 2PB, UK.

    ISBN 978-1-78883-868-9

    www.packt.com

    maptio Mapt is an online digital library that gives you full access to over - photo 3
    mapt.io

    Mapt is an online digital library that gives you full access to over 5,000 books and videos, as well as industry leading tools to help you plan your personal development and advance your career. For more information, please visit our website.

    Why subscribe?
    • Spend less time learning and more time coding with practical eBooks and Videos from over 4,000 industry professionals

    • Improve your learning with Skill Plans built especially for you

    • Get a free eBook or video every month

    • Mapt is fully searchable

    • Copy and paste, print, and bookmark content

    Packt.com

    Did you know that Packt offers eBook versions of every book published, with PDF and ePub files available? You can upgrade to the eBook version at www.packt.com and as a print book customer, you are entitled to a discount on the eBook copy. Get in touch with us at customercare@packtpub.com for more details.

    At www.packt.com , you can also read a collection of free technical articles, sign up for a range of free newsletters, and receive exclusive discounts and offers on Packt books and eBooks.

    Contributors
    About the author

    Tristan Guillevin is a true data lover who likes to share his passion. He graduated from engineering school in 2015. During these years, he went to Burkina Faso to teach computer science in schools around the country. The will to share and help people never left him since then. He started his professional life as a consultant at Actinvision, where he discovered Tableau. Soon, data visualization became a passion that has taken him around the world. In 2017, he won the Iron Viz (the ultimate data visualization battle organized by Tableau every year) in Las Vegas. Since his winning, he helps people with Tableau by making webinars, conferences, blog articles, and finally, this book! He's currently working at Ogury as a business analyst.

    First, I'd like to thanks my colleagues at Actinvision, Ogury and my friend, Maxime Baux, with whom I can share my passion. Of course, I would have never learned so much without the Tableau Community and amazing people like Eva Murray, Chloe Tseng, Jonni Walker, and Jade Le Van. Of course, a special thanks to Ivett Kovcs and Dilyana Bossenz for reviewing this book. Finally, a huge thanks to my family and my love, Laura, for their daily support.
    About the reviewers

    Ivett Kovcs was always very comfortable with dataafter majoring in statistics, she started working as a data analyst. She was one of the first Hungarian power users of Tableau Desktop, 2012, and has been mastering Tableau ever since. Currently, she is Starschema's senior data visualization expert, leading a team of 10+ dataviz developers.

    She is not only Tableau certified, but has also been a Tableau Ambassador since 2017. She is also a featured volunteer with Viz for Social Good. She has been developing several Tableau dashboards on various social topicsthe refugee crisis and gender inequality in tech companies and political institutions. Ivett has been writing a book for Packt Publishing, Tableau 2018.x Projects.

    Dilyana Bossenz works as a data analyst. Her professional focus is on data visualization and data analysis. She has a master's degree in business administration. She discovered her passion for data in 2014 at a workshop at Google when she was still a student. After that, she wrote a master's thesis about big data. She gained her first experience in Tableau as a four years intern in business intelligence. She is co-organizer of Tableau User Group and local chapter leader for Viz for Social Good in Berlin. In February 2018, she was recognized as a Tableau Feature Author.

    Packt is searching for authors like you

    If you're interested in becoming an author for Packt, please visit authors.packtpub.com and apply today. We have worked with thousands of developers and tech professionals, just like you, to help them share their insight with the global tech community. You can make a general application, apply for a specific hot topic that we are recruiting an author for, or submit your own idea.

    Preface

    Tableau is one of the leading business intelligence tools used worldwide, across organizations of all scale. In its latest release, Tableau 2018 promises richer and more useful features related to visual analytics, reporting, dashboarding, and a host of other data visualization aspects. Getting Started with Tableau 2018.x will get you up and running with these features.

    If you're familiar with Tableau, the book starts with the new functionalities of Tableau 2018, along with concrete examples of how to use them. However, if you're new to Tableau, don't worry! The rest of the book will guide you through each major aspect of Tableau with examples. You'll learn how to connect to data, build a data source, visualize your data, build a dashboard, and share it online. In the final chapters, you'll also learn advanced techniques such as creating a cross-database join and data blending.

    By the end of the book, you will have a firm understanding of how to effectively use Tableau to create quick, cost-effective, and business-efficient

    Next page
    Light

    Font size:

    Reset

    Interval:

    Bookmark:

    Make

    Similar books «Getting Started with Tableau 2018.x: Get up and running with the new features of Tableau 2018 for impactful data visualization»

    Look at similar books to Getting Started with Tableau 2018.x: Get up and running with the new features of Tableau 2018 for impactful data visualization. We have selected literature similar in name and meaning in the hope of providing readers with more options to find new, interesting, not yet read works.


    Reviews about «Getting Started with Tableau 2018.x: Get up and running with the new features of Tableau 2018 for impactful data visualization»

    Discussion, reviews of the book Getting Started with Tableau 2018.x: Get up and running with the new features of Tableau 2018 for impactful data visualization and just readers' own opinions. Leave your comments, write what you think about the work, its meaning or the main characters. Specify what exactly you liked and what you didn't like, and why you think so.