• Complain

Tom Schenk Jr. - Circos Data Visualization How-to

Here you can read online Tom Schenk Jr. - Circos Data Visualization How-to full text of the book (entire story) in english for free. Download pdf and epub, get meaning, cover and reviews about this ebook. year: 2012, publisher: Packt Publishing, genre: Computer. Description of the work, (preface) as well as reviews are available. Best literature library LitArk.com created for fans of good reading and offers a wide selection of genres:

Romance novel Science fiction Adventure Detective Science History Home and family Prose Art Politics Computer Non-fiction Religion Business Children Humor

Choose a favorite category and find really read worthwhile books. Enjoy immersion in the world of imagination, feel the emotions of the characters or learn something new for yourself, make an fascinating discovery.

Tom Schenk Jr. Circos Data Visualization How-to
  • Book:
    Circos Data Visualization How-to
  • Author:
  • Publisher:
    Packt Publishing
  • Genre:
  • Year:
    2012
  • Rating:
    3 / 5
  • Favourites:
    Add to favourites
  • Your mark:
    • 60
    • 1
    • 2
    • 3
    • 4
    • 5

Circos Data Visualization How-to: summary, description and annotation

We offer to read an annotation, description, summary or preface (depends on what the author of the book "Circos Data Visualization How-to" wrote himself). If you haven't found the necessary information about the book — write in the comments, we will try to find it.

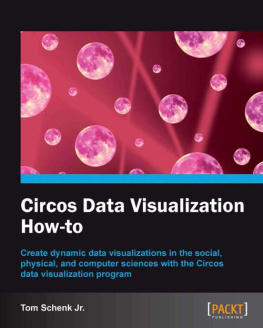
Create dynamic data visualizations in the social, physical, and computer sciences with the Circos data visualization program. Transform simple tables into engaging diagrams Learn to install Circos on Windows, Linux, and MacOS Create Circos diagrams using ribbons, heatmaps, and other data tracks In Detail Companies, non-profit organizations, and governments are collecting a large amount of data. Analysts and graphic designers are faced with a challenge of conveying data to a wide audience. This book introduces Circos, a creative program to display tables in an engaging visualization. Readers will learn how to install, create, and customize Circos diagrams using real-life examples from the social sciences. Circos Data Visualization How-To is a friendly, hands-on guide to creating diagrams with step-by-step instructions. Although Circos was originally created for genetic research, this book emphasizes using Circos in the social sciences. We will walk through the process to install, create, and customize diagrams. The book provides step-by-step instructions to installing Circos on your computer, transforming data sets to use in Circos, and creating diagrams in the social sciences. You will learn how to transform ordinary tables into engaging diagrams. We will walk through the installation process on Windows, Linux, and Mac OS. We will also learn how to transform raw data into a Circos-friendly format. The book is written as a friendly, hands-on guide so new users can walk through the installation and diagram-creation process. Readers will understand how to create Circos diagrams, from organizing data through to creating diagrams. What you will learn from this book This book is targeted to data visualization enthusiasts from all backgrounds Installing Circos on Windows, Linux, and Mac OS Organizing data to use with Circos Creating links and ribbons to visualize data in Circos Customize the format of Circos diagrams How to use Circos data tracks Apply Circos diagrams for use in the social sciences Format Circos diagrams with automatic rules Approach Recipes that follow a problem-solution approach. Its a friendly, hands-on guide to creating visualizations with step-by-step instructions. Who this book is written for This book is targeted at statisticians, analysts, and graphic designers with an interest in data visualization. The author does not presume any experience with Circos and steps through the installation and diagram creation process.

Tom Schenk Jr.: author's other books


Who wrote Circos Data Visualization How-to? Find out the surname, the name of the author of the book and a list of all author's works by series.

Circos Data Visualization How-to — read online for free the complete book (whole text) full work

Below is the text of the book, divided by pages. System saving the place of the last page read, allows you to conveniently read the book "Circos Data Visualization How-to" online for free, without having to search again every time where you left off. Put a bookmark, and you can go to the page where you finished reading at any time.

Light

Font size:

Reset

Interval:

Bookmark:

Make
Circos Data Visualization How-to

Circos Data Visualization How-to

Copyright 2012 Packt Publishing

All rights reserved. No part of this book may be reproduced, stored in a retrieval system, or transmitted in any form or by any means, without the prior written permission of the publisher, except in the case of brief quotations embedded in critical articles or reviews.

Every effort has been made in the preparation of this book to ensure the accuracy of the information presented. However, the information contained in this book is sold without warranty, either express or implied. Neither the author, nor Packt Publishing, and its dealers and distributors will be held liable for any damages caused or alleged to be caused directly or indirectly by this book.

Packt Publishing has endeavored to provide trademark information about all of the companies and products mentioned in this book by the appropriate use of capitals. However, Packt Publishing cannot guarantee the accuracy of this information.

First published: November 2012

Production Reference: 1151112

Published by Packt Publishing Ltd.

Livery Place

35 Livery Street

Birmingham B3 2PB, UK.

ISBN 978-1-84969-440-7

www.packtpub.com

Credits

Author

Tom Schenk Jr.

Reviewer

Gentle Yang

Acquisition Editor

Kartikey Pandey

Commissioning Editor

Harsha Bharwani

Technical Editor

Prasanna Joglekar

Copy Editor

Aditya Nair

Project Coordinator

Esha Thakker

Proofreader

Maria Gould

Production Coordinator

Prachali Bhiwandkar

Cover Work

Prachali Bhiwandkar

Cover Image

Conidon Miranda

About the Author

Tom Schenk Jr. is the Director of Analytics for the city of Chicago. He also maintains the Data Nouveau website at www.datanouveau.net. Tom has written numerous scholarly articles on data visualization, education, and economic research. He has emphasized the use of data visualization techniques in governmental reports. Previously, he was an Educational Consultant for the Iowa Department of Education and Senior Analyst at Department of Medical Social Sciences at Northwestern University.

I am forever indebted to my parents, Tom and Julie.

About the Reviewer

Gentle Yang is a crossover developer with focus on SNS, Mobile Internet, Bioinformatics, Genomics, and also data visualization in several areas such as SNS data, social events data, and charity community data.

Gentle Yang is currently the senior engineer at TCL, responsible for TCL cloud platform and open API projects. He received his B.S. degree in Computing and Information Science at NEFU in Harbin (2007), where he read computing math, computer science, and Bioinformatics. Before joining TCL, Gentle Yang was a Bioinformatics Software Engineer at BGI, which is the world's biggest genome sequencing center, and he focused on Bioinformatics application building, data analysis for the genome project, and data visualization in Bioinformatics and Genomics.

Thanks to the author of Circos, Krzywinski Martin.

www.PacktPub.com
Support files, eBooks, discount offers and more

You might want to visit www.PacktPub.com for support files and downloads related to your book.

Did you know that Packt offers eBook versions of every book published, with PDF and ePub files available? You can upgrade to the eBook version at > for more details.

At www.PacktPub.com, you can also read a collection of free technical articles, sign up for a range of free newsletters and receive exclusive discounts and offers on Packt books and eBooks.

httpPacktLibPacktPubcom Do you need instant solutions to your IT - photo 1

http://PacktLib.PacktPub.com

Do you need instant solutions to your IT questions? PacktLib is Packt's online digital book library. Here, you can access, read and search across Packt's entire library of books.

Why Subscribe?
  • Fully searchable across every book published by Packt
  • Copy and paste, print and bookmark content
  • On demand and accessible via web browser
Free Access for Packt account holders

If you have an account with Packt at www.PacktPub.com, you can use this to access PacktLib today and view nine entirely free books. Simply use your login credentials for immediate access.

Preface

I am very pleased to have had an opportunity to write this book on Circos. It is a wonderful program that is innovative and applicable to many fields. Oddly, my first experience with Circos, after seeing an article on the cover of a 2007 American Scientist magazine, was to dismiss the diagrams as they were too complex. Yet, I found them to be beautiful and fascinating. I reflected on how the diagrams could be used to tell a story. Several months later I found myself using the program for a project, Visualizing Transitions into the Workforce. The response was outstanding! Lay readers became engaged in the diagram, both understanding the story and asking sophisticated questions. As with any data visualization project, Circos' diagrams were able to engage readers and convey an important story.

The goal of this book is twofold. First, I wanted the book to be accessible to all users who have an interest in displaying data and relationships to a broad audience. In my experience, many usersparticularly those using Windowsbecome frustrated when trying to install and create their first diagram.

Secondly, I want to show how Circos can be used in the social sciences even though the program's roots are in Bioinformatics, specifically Genetics. It is a powerful tool for social sciences, including Political Science, Economics, Education, and other fields.

I hope you enjoy this book and Circos.

What this book covers

Installing Circos on Windows 7 (Must know) , explains one of the most challenging aspects of Circos, which is to install and run on the Windows operating system. We will walk through the installation process by showing each step. The recipe also highlights how each step is necessary to create the Circos diagram, and discusses common issues and solutions typically seen during installation.

Installing Circos on Linux or Mac OS (Must know) , discusses each step needed to install Circos on a Linux or Mac OS X operating system. Despite the variety of Linux operating systems, the recipe demonstrates the installation process solely through commands in the Terminal window. It highlights issues typically faced during installation for Linux users, and their solutions, just like the previous recipe does for Windows users.

Creating the first Circos diagram (Must know) , shows you how to create a basic diagram in Circos after installation, to show the basic relationships with ribbons. This recipe also shows you how to transform survey data in a proper format to be used for Circos. It discusses each step needed to create a new visualization.

Customizing Circos layout (Should know) , discusses how to adjust which data to plot, adding and customizing labels, and adding tick marks. The appearance of a Circos diagram is highly customizable. As an example, this recipe uses political contributions from each U.S. State to trace and investigate the patterns.

Next page
Light

Font size:

Reset

Interval:

Bookmark:

Make

Similar books «Circos Data Visualization How-to»

Look at similar books to Circos Data Visualization How-to. We have selected literature similar in name and meaning in the hope of providing readers with more options to find new, interesting, not yet read works.


Reviews about «Circos Data Visualization How-to»

Discussion, reviews of the book Circos Data Visualization How-to and just readers' own opinions. Leave your comments, write what you think about the work, its meaning or the main characters. Specify what exactly you liked and what you didn't like, and why you think so.