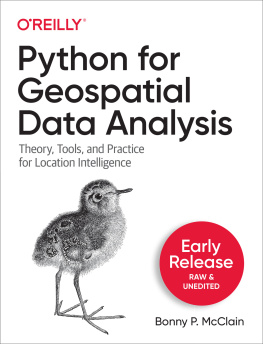
Bonny P. McClain - Python for Geospatial Data Analysis
Here you can read online Bonny P. McClain - Python for Geospatial Data Analysis full text of the book (entire story) in english for free. Download pdf and epub, get meaning, cover and reviews about this ebook. year: 2022, publisher: OReilly Media, Inc., genre: Home and family. Description of the work, (preface) as well as reviews are available. Best literature library LitArk.com created for fans of good reading and offers a wide selection of genres:
Romance novel
Science fiction
Adventure
Detective
Science
History
Home and family
Prose
Art
Politics
Computer
Non-fiction
Religion
Business
Children
Humor
Choose a favorite category and find really read worthwhile books. Enjoy immersion in the world of imagination, feel the emotions of the characters or learn something new for yourself, make an fascinating discovery.
- Book:Python for Geospatial Data Analysis
- Author:
- Publisher:OReilly Media, Inc.
- Genre:
- Year:2022
- Rating:3 / 5
- Favourites:Add to favourites
- Your mark:
- 60
- 1
- 2
- 3
- 4
- 5
Python for Geospatial Data Analysis: summary, description and annotation
We offer to read an annotation, description, summary or preface (depends on what the author of the book "Python for Geospatial Data Analysis" wrote himself). If you haven't found the necessary information about the book — write in the comments, we will try to find it.
Python for Geospatial Data Analysis — read online for free the complete book (whole text) full work
Below is the text of the book, divided by pages. System saving the place of the last page read, allows you to conveniently read the book "Python for Geospatial Data Analysis" online for free, without having to search again every time where you left off. Put a bookmark, and you can go to the page where you finished reading at any time.
Font size:
Interval:
Bookmark:

by Bonny P. McClain
Copyright 2022 Grapheme Consulting, Inc. All rights reserved.
Printed in the United States of America.
Published by OReilly Media, Inc. , 1005 Gravenstein Highway North, Sebastopol, CA 95472.
OReilly books may be purchased for educational, business, or sales promotional use. Online editions are also available for most titles (http://oreilly.com). For more information, contact our corporate/institutional sales department: 800-998-9938 or corporate@oreilly.com .
- Editors: Michelle Smith and Sarah Grey
- Production Editor: Kate Galloway
- Interior Designer: David Futato
- Cover Designer: Karen Montgomery
- Illustrator: Kate Dullea
- May 2022: First Edition
- 2021-08-25: First Release
See http://oreilly.com/catalog/errata.csp?isbn=9781098104795 for release details.
The OReilly logo is a registered trademark of OReilly Media, Inc. Python for Geospatial Data Analysis, the cover image, and related trade dress are trademarks of OReilly Media, Inc.
The views expressed in this work are those of the author, and do not represent the publishers views. While the publisher and the author have used good faith efforts to ensure that the information and instructions contained in this work are accurate, the publisher and the author disclaim all responsibility for errors or omissions, including without limitation responsibility for damages resulting from the use of or reliance on this work. Use of the information and instructions contained in this work is at your own risk. If any code samples or other technology this work contains or describes is subject to open source licenses or the intellectual property rights of others, it is your responsibility to ensure that your use thereof complies with such licenses and/or rights.
978-1-098-10472-6
With Early Release ebooks, you get books in their earliest formthe authors raw and unedited content as they writeso you can take advantage of these technologies long before the official release of these titles.
This will be the 1st chapter of the final book.
If you have comments about how we might improve the content and/or examples in this book, or if you notice missing material within this chapter, please reach out to the author at bonny@dataanddonuts.org.
Are you a geographer, geologist, or computer scientist? Impressive if you answered yes, but I am a spatial data analyst. In a nutshell, I am interested in exploring data and integrating location. Now that access to location data and geospatial datasets is fairly ubiquitous, most of us are becoming data curious regardless of professional title or area of study. Appreciating the where in our analyses introduces a new dimension of comprehending the impact of a wider variety of features on a particular observation or outcome. I spend a lot of professional time examining public health data and large open source datasets in healthcare. Once you become familiar with geocoding and spatial files, not only can you curate insights across multiple domains but you will also be able to target areas where profound gaps exist.
This is also the age of citizen scientists. The accessibility of open source tools and massive open online courses (MOOCs) empowers a broader range of not only professionals but also the data curious. Perhaps you have a hobby or interest in a certain species of bird and would like to access spatial data to learn about their habitats. Where are they nesting? Where are they traveling from and to? Which habitats support the most species and how is this changing over time? You might be able to create maps of your sightings or other variables of interest. Well explore this idea a little later when we generate a data question to explore.
Meanwhile, if you are interested in a citizen scientist project look no further than the New York Public Library (NYPL) Map Warper project. As you might imagine, NYPL has a vast amount of historical maps. The challenge is to correct the errors in outdated survey technology by searching for modern matching ground control points (GCPs) and warp the image accordingly. This is known as map rectification.
The ) is a tool for rectifying (digitally aligning) historical maps from the NYPLs collections to match todays precise maps. Visitors can browse already rectified maps or assist the NYPL by aligning a map. Everyone is welcome to participate!
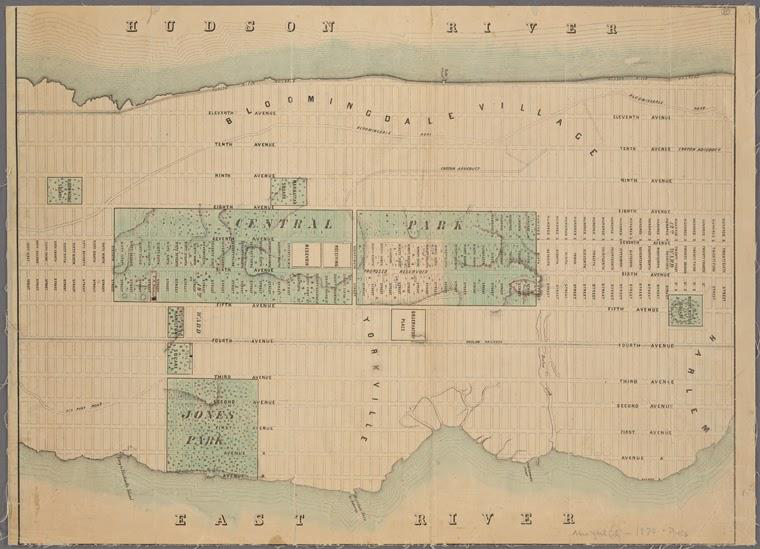
I have used rectified maps to explore development over time in different cities or to accurately reimagine a historical location. How do investments in infrastructure and industrial development impact neighborhoods over time, for example? shows a rectified map.
There are many opportunities for professionals across multiple industries to include location intelligence in their analytics. Location intelligence describes actionable information derived from exploring geospatial relationships when formulating data questions and evaluating hypotheses. Open source tools are welcoming new end-users, and what we need is a lexicon applicable to a myriad of diverse interests, resources, and learning pedigrees. Yes, enterprise solutions are powerful, but many have limited access to subscription-based applications and tools. There are a variety of options in geographic information systems (GIS) software with pros and cons associated with all of them. I will mention a few when they come up, but although I have access to both ArcGIS also known as Aeronautical Reconnaissance Coverage Geographic Information System and QGIS, Quantum GIS I like to give QGIS the main stage. It is truly open source, meaning that you dont need different levels of licensing for access to all of the available tools. Since this book is intended for a wide level of interests, I want you to be able to explore all of the tools. In my professional work, yes I will move between both ArcGIS and QGIS -- mainly for access to the abundant catalog of GIS datasets in ArcGIS online. I did have to learn the hard way when geocoding in ArcGIS. ArcGIS uses a credit system, and it was easy for me to unknowingly get on the wrong end of it. I didnt realize that the paid service kicked in fairly automatically when I uploaded a CSV file with location data. QGIS, on the other hand, offers two options we will explore later -- both free.
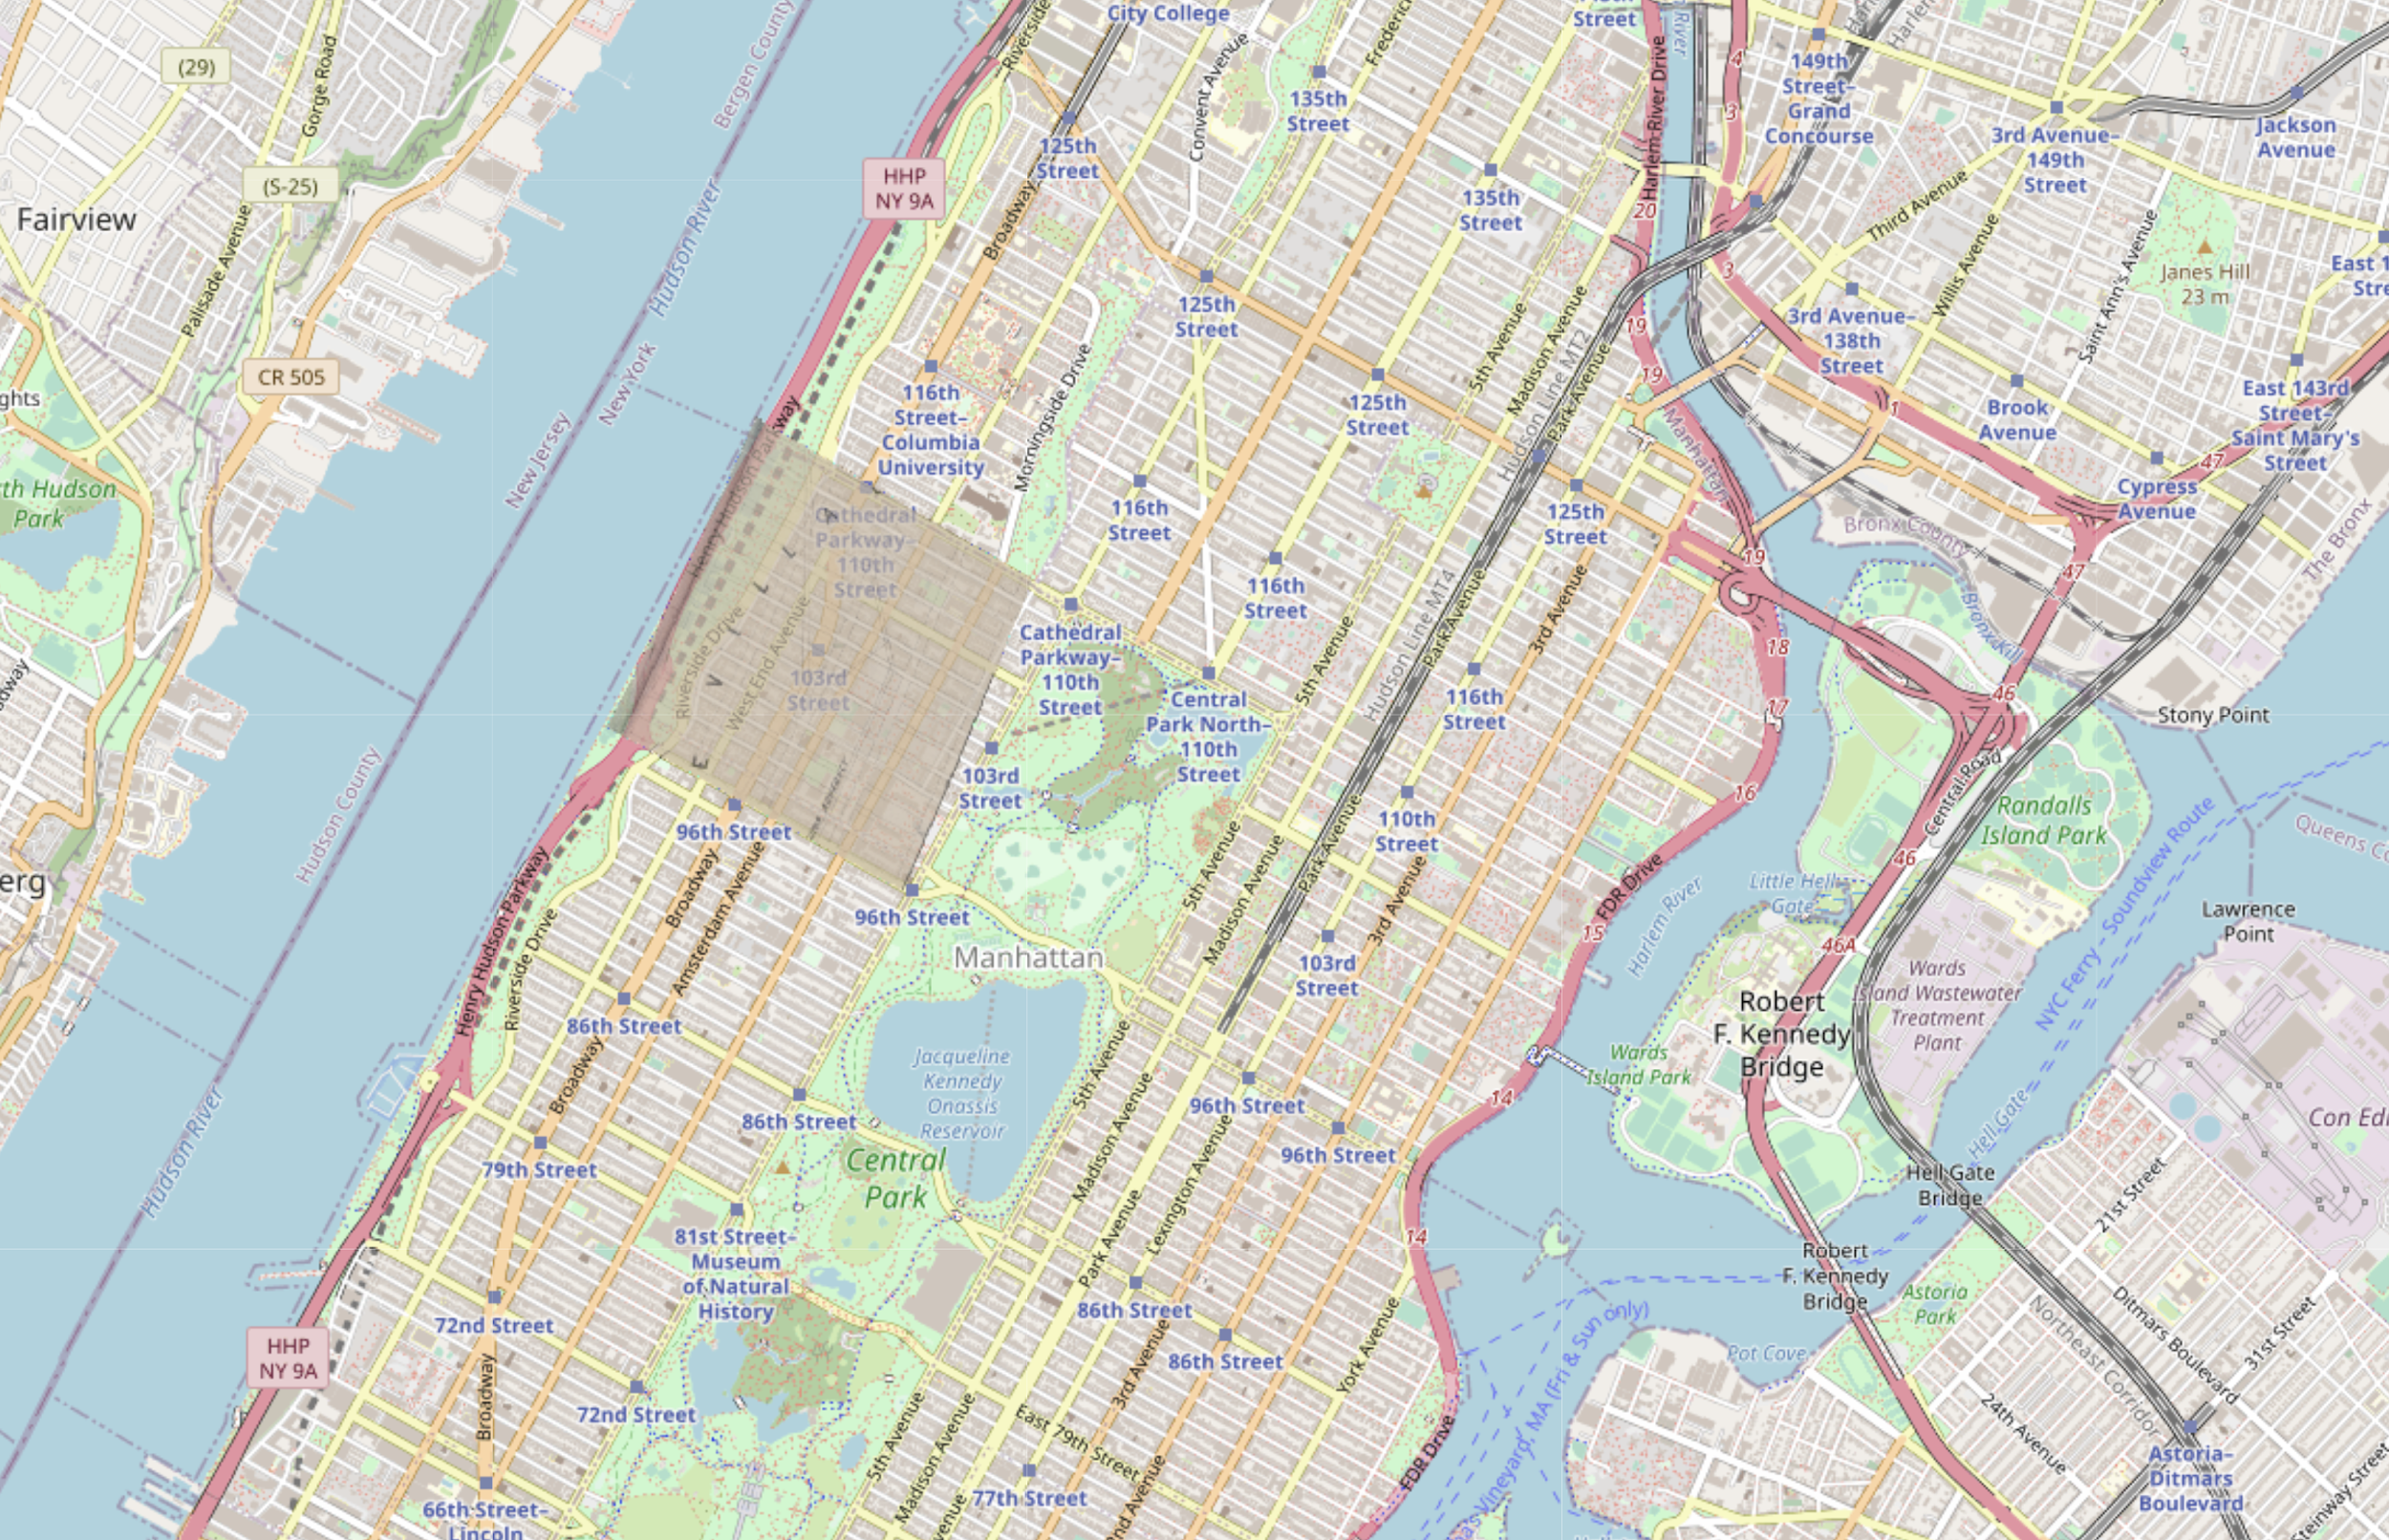
The polygons on the map in are different colors corresponding to racial categories. What might we determine about these clusters if we also examine other attributes? Lets sit with these questions for a while. I will give you a hint: the devil is in the details, or should I say, is in the layers. The polygons are shaded based on areas where a certain race is the majority population. This is a good place to introduce the expression defaults should not be the endpoints. A deeper understanding of GIS will allow you to move away from default settings and create unique and deeper insights.
Font size:
Interval:
Bookmark:
Similar books «Python for Geospatial Data Analysis»
Look at similar books to Python for Geospatial Data Analysis. We have selected literature similar in name and meaning in the hope of providing readers with more options to find new, interesting, not yet read works.
Discussion, reviews of the book Python for Geospatial Data Analysis and just readers' own opinions. Leave your comments, write what you think about the work, its meaning or the main characters. Specify what exactly you liked and what you didn't like, and why you think so.

