
Copyright 2001, 1996, 1991, 1985 by Gene Zelazny, and from Say It With Charts Workbook by Gene Zelazny, copyright 2005 by Gene Zelazny. Compilation and new material copyright 2007 by Gene Zelazny. All rights reserved. Except as permitted under the United States Copyright Act of 1976, no part of this publication may be reproduced or distributed in any form or by any means, or stored in a database or retrieval system, without the prior written permission of the publisher.
ISBN: 978-0-07-163116-7
MHID: 0-07-163116-X
The material in this eBook also appears in the print version of this title: ISBN: 978-0-07-147470-2, MHID: 0-07-147470-6
All trademarks are trademarks of their respective owners. Rather than put a trademark symbol after every occurrence of a trademarked name, we use names in an editorial fashion only, and to the benefit of the trademark owner, with no intention of infringement of the trademark. Where such designations appear in this book, they have been printed with initial caps.
McGraw-Hill eBooks are available at special quantity discounts to use as premiums and sales promotions, or for use in corporate training programs. To contact a representative please e-mail us at bulksales@mcgraw-hill.com.
This publication is designed to provide accurate and authoritative information in regard to the subject matter covered. It is sold with the understanding that the publisher is not engaged in rendering legal, accounting, or other professional service. If legal advice or other expert assistance is required, the services of a competent professional person should be sought.
From a Declaration of Principles Jointly Adopted by a Committee of the American Bar Association and a Committee of Publishers and Associations
TERMS OF USE
This is a copyrighted work and The McGraw-Hill Companies, Inc. (McGraw-Hill) and its licensors reserve all rights in and to the work. Use of this work is subject to these terms. Except as permitted under the Copyright Act of 1976 and the right to store and retrieve one copy of the work, you may not decompile, disassemble, reverse engineer, reproduce, modify, create derivative works based upon, transmit, distribute, disseminate, sell, publish or sublicense the work or any part of it without McGraw-Hills prior consent. You may use the work for your own noncommercial and personal use; any other use of the work is strictly prohibited. Your right to use the work may be terminated if you fail to comply with these terms.
THE WORK IS PROVIDED AS IS. McGRAW-HILL AND ITS LICENSORS MAKE NO GUARANTEES OR WARRANTIES AS TO THE ACCURACY, ADEQUACY OR COMPLETENESS OF OR RESULTS TO BE OBTAINED FROM USING THE WORK, INCLUDING ANY INFORMATION THAT CAN BE ACCESSED THROUGH THE WORK VIA HYPERLINK OR OTHERWISE, AND EXPRESSLY DISCLAIM ANY WARRANTY, EXPRESS OR IMPLIED, INCLUDING BUT NOT LIMITED TO IMPLIED WARRANTIES OF MERCHANTABILITY OR FITNESS FOR A PARTICULAR PURPOSE. McGraw-Hill and its licensors do not warrant or guarantee that the functions contained in the work will meet your requirements or that its operation will be uninterrupted or error free. Neither McGraw-Hill nor its licensors shall be liable to you or anyone else for any inaccuracy, error or omission, regardless of cause, in the work or for any damages resulting therefrom. McGraw-Hill has no responsibility for the content of any information accessed through the work. Under no circumstances shall McGraw-Hill and/or its licensors be liable for any indirect, incidental, special, punitive, consequential or similar damages that result from the use of or inability to use the work, even if any of them has been advised of the possibility of such damages. This limitation of liability shall apply to any claim or cause whatsoever whether such claim or cause arises in contract, tort or otherwise.
To Ken Haemer
If we define originality as undiscovered plagiarism, then this book is original. Much of the credit for the ideas presented in this book belongs to the late Kenneth W. Haemer (formerly Manager, Presentation Research, AT&T). Over the years Ken was both mentor and friend. Thank you, Ken. I miss you.
If Ken made me think, then McKinsey & Company, Inc., provided me with a home to apply and advance my ideas. And so, let me also thank the hundreds of professional consultants I work with at McKinsey. Its a privilege and a pleasure.
Last, many, many thanks to all of you who have assisted in making this book a reality.
CONTENTS
Introduction
SAY IT WITH CHARTS
Section I
CHOOSING CHARTS
Section II
USING CHARTS
Section III
SAY IT WITH CONCEPTS AND METAPHORS
Section IV
PLAY IT WITH CHARTS
What do you mean, what does it mean?
Introduction
SAY IT WITH CHARTS
Its 9:00 a.m. on the third Tuesday of the month, time for the monthly meeting of the Steering Committee. To set the rest of the days proceedings in perspective, the committee chairman has asked a bright, fast-rising managerlets call him Frankto prepare a brief presentation on the state of the industry in which we compete and our companys performance as a stepping-stone for new investment opportunities.
Intent on doing a good job, Frank has done much research, worked on his story line, and prepared a series of visual aids to help him say it with charts. Like most of us, Frank realizes that charts are an important form of language. Theyre important because, when well conceived and designed, they help us communicate more quickly and more clearly than we would if we left the data in tabular form.
When charts arent well conceived or designed, as were about to see in Franks examples, they serve more to confuse than to clarify. Lets sit with the audience and listen to Franks presentation as we comment, quietly, on the effectiveness of his visuals.
Frank begins: Good morning ladies and gentlemen. My purpose is to present a brief overview of our industry and our companys performance. My objective is to gain your support for expanding into developing countries. Ive designed a few visual aids to better place my findings in perspective.
First, let me point out that we compete in a healthy industry. As you can clearly see from this exhibit, for the 11 measures of performance shown across the top and the three types of companies within the industry listed down the side, performance is excellent.
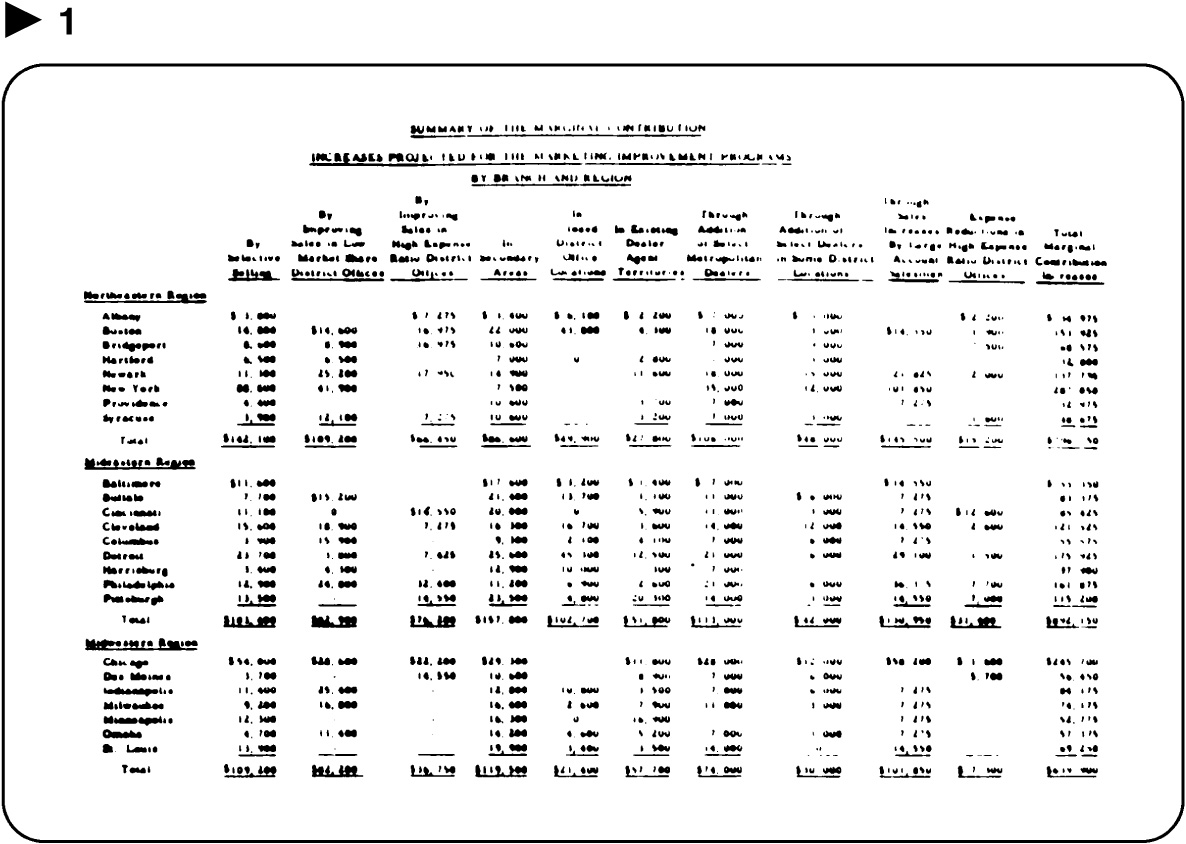
And there you sit in the audience, wondering whether your eyesight is failing, as you try in vain to read the numbers.
Frank continues: Within the industry, our performance has been outstanding. For instance, our sales have grown, considerably since 2000, in spite of the decline in 2002, which, as you know, was the result of the strike.
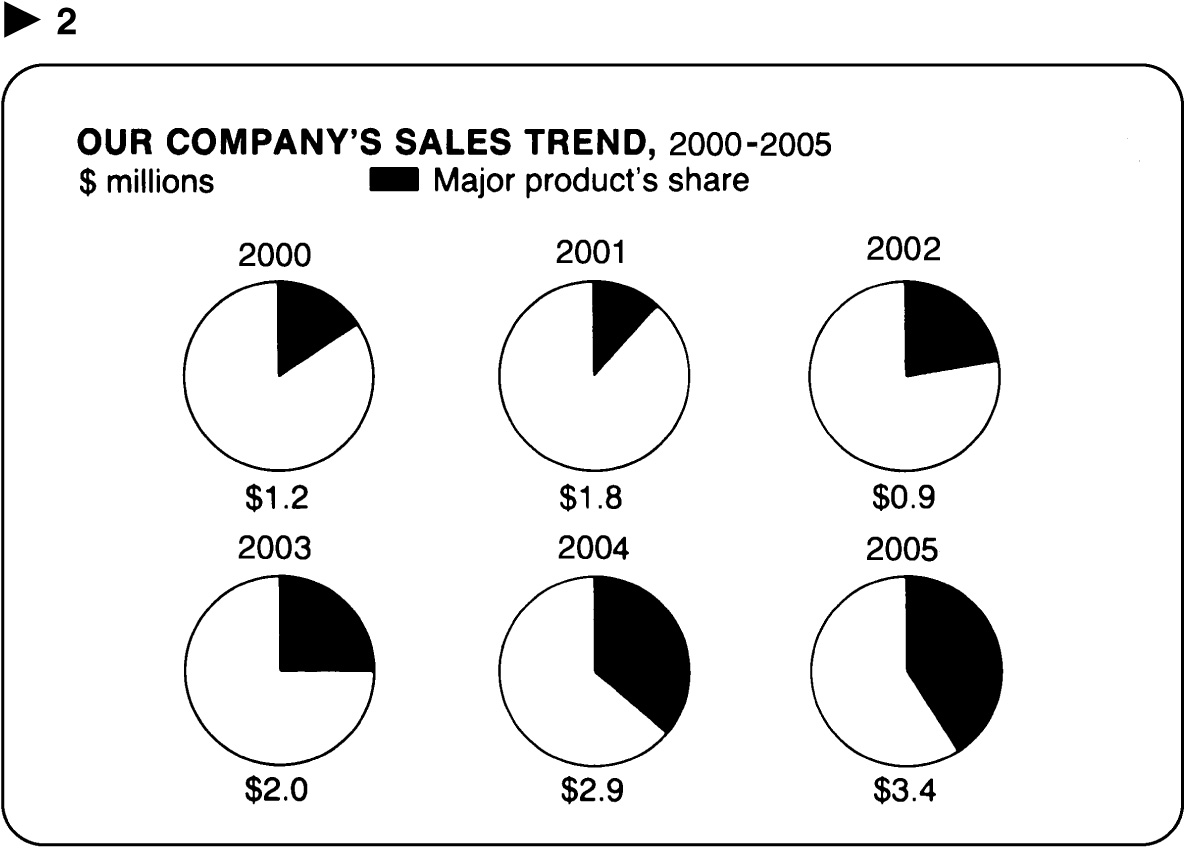
Oops, you whisper, did I just miss something? I could swear I heard Frank say that sales have grown considerably, but what I see is a series of pie charts that show our major products share increasing. Oh! Wait a minute. I see! Hes referring to the figures underneath each pie .
Next page

