• Complain

Andy Kirk - Data Visualization: a successful design process

Here you can read online Andy Kirk - Data Visualization: a successful design process full text of the book (entire story) in english for free. Download pdf and epub, get meaning, cover and reviews about this ebook. year: 2012, publisher: Packt Publishing, genre: Home and family. Description of the work, (preface) as well as reviews are available. Best literature library LitArk.com created for fans of good reading and offers a wide selection of genres:

Romance novel Science fiction Adventure Detective Science History Home and family Prose Art Politics Computer Non-fiction Religion Business Children Humor

Choose a favorite category and find really read worthwhile books. Enjoy immersion in the world of imagination, feel the emotions of the characters or learn something new for yourself, make an fascinating discovery.

Andy Kirk Data Visualization: a successful design process
  • Book:
    Data Visualization: a successful design process
  • Author:
  • Publisher:
    Packt Publishing
  • Genre:
  • Year:
    2012
  • Rating:
    4 / 5
  • Favourites:
    Add to favourites
  • Your mark:
    • 80
    • 1
    • 2
    • 3
    • 4
    • 5

Data Visualization: a successful design process: summary, description and annotation

We offer to read an annotation, description, summary or preface (depends on what the author of the book "Data Visualization: a successful design process" wrote himself). If you haven't found the necessary information about the book — write in the comments, we will try to find it.

A structured design approach to equip you with the knowledge of how to successfully accomplish any data visualization challenge efficiently and effectively
Overview
A portable, versatile and flexible data visualization design approach that will help you navigate the complex path towards success
Explains the many different reasons for creating visualizations and identifies the key parameters which lead to very different design options.
Thorough explanation of the many visual variables and visualization taxonomy to provide you with a menu of creative options.
In Detail
Do you want to create more attractive charts? Or do you have huge data sets and need to unearth the key insights in a visual manner? Data visualization is the representation and presentation of data, using proven design techniques to bring alive the patterns, stories and key insights locked away.
Data Visualization: a Successful Design Process explores the unique fusion of art and science that is data visualization a discipline for which instinct alone is insufficient for you to succeed in enabling audiences to discover key trends, insights and discoveries from your data. This book will equip you with the key techniques required to overcome contemporary data visualization challenges.
Youll discover a proven design methodology that helps you develop invaluable knowledge and practical capabilities.
Youll never again settle for a default Excel chart or resort to fancy-looking graphs. You will be able to work from the starting point of acquiring, preparing and familiarizing with your data, right through to concept design. Choose your killer visual representation to engage and inform your audience.
Data Visualization: a Successful Design Process will inspire you to relish any visualization project with greater confidence and bullish know-how turning challenges into exciting design opportunities.
What you will learn from this book
A comprehensive and contemporary introduction to data driven visualization design and the most effective approaches to tackle any design challenge.
How to achieve maximum impact with designs that engage on an aesthetic level and perform on a functional one.
Foundation understanding of the human visual system
Identifying the purpose of your visualization and your projects parameters to determine overriding design considerations across your projects execution
How to develop analytical questions and identify a visual narrative as you immerse yourself in your data, familiarizing with its inherent qualities
Apply critical thinking to visualization design and get intimate with your dataset to identify its potential visual characteristics
Appreciating the importance of an editorial approach to design and best practice approaches for tackling different data types and problem contexts
A thorough overview of the anatomy of a data visualization design and a menu of the most important and innovative visualization methods
Overview of the essential visualization tools and resources
Profile of some of the most impressive and inspiring contemporary visualization projects
Approach
A comprehensive yet quick guide to the best approaches to designing data visualizations, with real examples and illustrative diagrams. Whatever the desired outcome ensure success by following this expert design process.

Andy Kirk: author's other books


Who wrote Data Visualization: a successful design process? Find out the surname, the name of the author of the book and a list of all author's works by series.

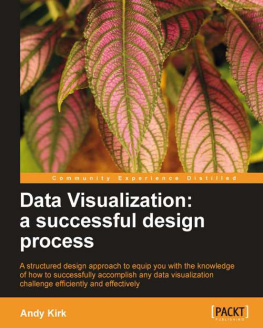
Data Visualization: a successful design process — read online for free the complete book (whole text) full work

Below is the text of the book, divided by pages. System saving the place of the last page read, allows you to conveniently read the book "Data Visualization: a successful design process" online for free, without having to search again every time where you left off. Put a bookmark, and you can go to the page where you finished reading at any time.

Light

Font size:

Reset

Interval:

Bookmark:

Make
Data Visualization: a successful design process

Data Visualization: a successful design process

Copyright 2012 Packt Publishing

All rights reserved. No part of this book may be reproduced, stored in a retrieval system, or transmitted in any form or by any means, without the prior written permission of the publisher, except in the case of brief quotations embedded in critical articles or reviews.

Every effort has been made in the preparation of this book to ensure the accuracy of the information presented. However, the information contained in this book is sold without warranty, either express or implied. Neither the author, nor Packt Publishing, and its dealers and distributors will be held liable for any damages caused or alleged to be caused directly or indirectly by this book.

Packt Publishing has endeavored to provide trademark information about all of the companies and products mentioned in this book by the appropriate use of capitals. However, Packt Publishing cannot guarantee the accuracy of this information.

First published: December 2012

Production Reference: 1191212

Published by Packt Publishing Ltd.

Livery Place

35 Livery Street

Birmingham B3 2PB, UK.

ISBN 978-1-84969-346-2

www.packtpub.com

Cover Image by Duraid Fatouhi (<>)

Credits

Authors

Andy Kirk

Reviewers

Alberto Cairo

Ben Jones

Santiago Ortiz

Jerome Cukier

Acquisition Editor

Joanna Finchen

Lead Technical Editor

Shreerang Deshpande

Technical Editor

Dominic Pereira

Project Coordinator

Joel Goveya

Proofreader

Chris Brown

Indexer

Tejal Soni

Graphics

Aditi Gajjar

Production Coordinator

Prachali Bhiwandkar

Cover Work

Prachali Bhiwandkar

About the Author

Andy Kirk is a freelance data visualization design consultant, training provider, and editor of the popular data visualization blog, visualisingdata.com.

After graduating from Lancaster University with a B.Sc. (Hons) degree in Operational Research, he spent over a decade at a number of the UK's largest organizations in a variety of business analysis and information management roles.

Late 2006 provided Andy with a career-changing "eureka" moment through the serendipitous discovery of data visualization and he has passionately pursued this subject ever since, completing an M.A. (with Distinction) at the University of Leeds along the way.

In February 2010, he launched visualisingdata.com with a mission to provide readers with inspiring insights into the contemporary techniques, resources, applications, and best practices around this increasingly popular field. His design consultancy work and training courses extend this ambition, helping organizations of all shapes, sizes, and industries to enhance the analysis and communication of their data to maximize impact.

This book aims to pass on some of the expertise Andy has built up over these years to provide readers with an informative and helpful guide to succeeding in the challenging but exciting world of data visualization design.

Thanks go to my family and friends, but especially to my wonderful wife, Ellie, for her unwavering support, patience, and guidance.

About the Reviewers

Alberto Cairo has taught infographics and data visualization at the University of Miami since January 2012. He is the author of the book The Functional Art: An Introduction to Information Graphics and Visualization ( Peachpit/Pearson , 2012, http://www.thefunctionalart.com). He has been director of infographics at El Mundo online, Spain (2000-2005), professor of infographics and visualization at the University of North Carolina-Chapel Hill (2005-2009), and director of infographics and multimedia at poca magazine, Brazil (2010-2011). In the past decade, he has consulted with media organizations and educational institutions in nearly 20 countries.

Ben Jones is founder of Data Remixed, a website dedicated to exploring and sharing data analysis and data visualization in an engaging way. Ben has a mechanical engineering and business (entrepreneurship) background, and has spent time as a process improvement expert and trainer in Corporate America. Ben specializes in creating interactive data visualizations with Tableau software, and has won a number of Tableau data visualization competitions. This is Ben's first contribution to a book on the subject of data visualization.

I'd like to thank Andy Kirk for selecting me to contribute as a technical reviewer of this book, and my wife Sarah for all the support she gives me in pursuing my passion of the field of data visualization. I'd also like to thank my fellow technical reviewers, from whom I have learned a great deal over the course of the creation of this book.

Santiago Ortiz invents and develops highly innovative and interactive projects for the Web, using self-built frameworks in JavaScript, HTML5, and ActionScript.

He has over more than 10 years of experience working on interactive visualization projects. In 2005, he co-founded Bestiario (http://bestiario.org), the first European company specializing in information visualization. Currently, he freelances in the U.S.A. and Europe.

He has presented at events such as VISWEEK, FutureEverything, VizEurope, O'Reilly STRATA, SocialMediaWeek, NYViz, OFFF, and ARS ELECTRONICA.

His projects have been featured in blogs such as ReadWriteWeb, FlowingData, O'REILLY radar, Fast CoDesign, Gizmodo, and The Guardian datablog.

Jerome Cukier is a highly respected Paris-based data visualization consultant with many years of experience as a data analyst and coordinator of data visualization initiatives at the OECD. Jerome specializes in the creation and design

of data visualizations, data analytics, and gamification. His broad portfolio of work is regularly profiled on the leading visualization and design websites and collated on his own site at http://www.jeromecukier.net.

www.PacktPub.com
Support files, eBooks, discount offers and more

You might want to visit www.PacktPub.com for support files and downloads related to your book.

Did you know that Packt offers eBook versions of every book published, with PDF and ePub files available? You can upgrade to the eBook version at > for more details.

At www.PacktPub.com, you can also read a collection of free technical articles, sign up for a range of free newsletters and receive exclusive discounts and offers on Packt books and eBooks.

httpPacktLibPacktPubcom Do you need instant solutions to your IT - photo 1

http://PacktLib.PacktPub.com

Do you need instant solutions to your IT questions? PacktLib is Packt's online digital book library. Here, you can access, read and search across Packt's entire library of books.

Why Subscribe?
  • Fully searchable across every book published by Packt
  • Copy and paste, print and bookmark content
  • On demand and accessible via web browser
Free Access for Packt account holders

If you have an account with Packt at www.PacktPub.com, you can use this to access PacktLib today and view nine entirely free books. Simply use your login credentials for immediate access.

Next page
Light

Font size:

Reset

Interval:

Bookmark:

Make

Similar books «Data Visualization: a successful design process»

Look at similar books to Data Visualization: a successful design process. We have selected literature similar in name and meaning in the hope of providing readers with more options to find new, interesting, not yet read works.


Reviews about «Data Visualization: a successful design process»

Discussion, reviews of the book Data Visualization: a successful design process and just readers' own opinions. Leave your comments, write what you think about the work, its meaning or the main characters. Specify what exactly you liked and what you didn't like, and why you think so.