Gareth Cook (foreword) - The Best American Infographics 2016
Here you can read online Gareth Cook (foreword) - The Best American Infographics 2016 full text of the book (entire story) in english for free. Download pdf and epub, get meaning, cover and reviews about this ebook. year: 2016, publisher: Mariner Books, genre: Politics. Description of the work, (preface) as well as reviews are available. Best literature library LitArk.com created for fans of good reading and offers a wide selection of genres:
Romance novel
Science fiction
Adventure
Detective
Science
History
Home and family
Prose
Art
Politics
Computer
Non-fiction
Religion
Business
Children
Humor
Choose a favorite category and find really read worthwhile books. Enjoy immersion in the world of imagination, feel the emotions of the characters or learn something new for yourself, make an fascinating discovery.
- Book:The Best American Infographics 2016
- Author:
- Publisher:Mariner Books
- Genre:
- Year:2016
- Rating:3 / 5
- Favourites:Add to favourites
- Your mark:
The Best American Infographics 2016: summary, description and annotation
We offer to read an annotation, description, summary or preface (depends on what the author of the book "The Best American Infographics 2016" wrote himself). If you haven't found the necessary information about the book — write in the comments, we will try to find it.
When it comes to infographicsthe best work in this field grabs those eyes, keeps them glued, and the grip is sensualand often immediate. A good graphic says See what I see! and either you do or you dont. The best onespull you right in, and wont let you go.
From the introduction by Robert Krulwich
The years most awesome (RedOrbit) infographics reveal aspects of our world in often startling waysfrom a haunting graphic mapping the journey of 15,790 slave ships over 315 years, to a yearlong data drawing project on postcards that records and cements a trans-Atlantic friendship. The Best American Infographics 2016 covers the realms of social issues, health, sports, arts and culture, and politicsincluding crisp visual data on the likely Democratic/Republican leanings of an array of professions (proving that your urologist is far more likely to be a Republican than your pediatrician). Here once again are the most innovative print and electronic infographicsthe full spectrum of the genrefrom authoritative to playful (Scientific American). ROBERT KRULWICH is the cohost of Radiolab and a science correspondent for NPR. He writes, draws, and cartoons at Curiously Krulwich, where he synthesizes scientific concepts into colorful, one-of-a-kind blog posts. He has won several Emmy awards for his work on television, and has been called the most inventive network reporter in television by TV Guide.
Gareth Cook (foreword): author's other books
Who wrote The Best American Infographics 2016? Find out the surname, the name of the author of the book and a list of all author's works by series.

The Best American Infographics 2016 — read online for free the complete book (whole text) full work
Below is the text of the book, divided by pages. System saving the place of the last page read, allows you to conveniently read the book "The Best American Infographics 2016" online for free, without having to search again every time where you left off. Put a bookmark, and you can go to the page where you finished reading at any time.
Font size:
Interval:
Bookmark:

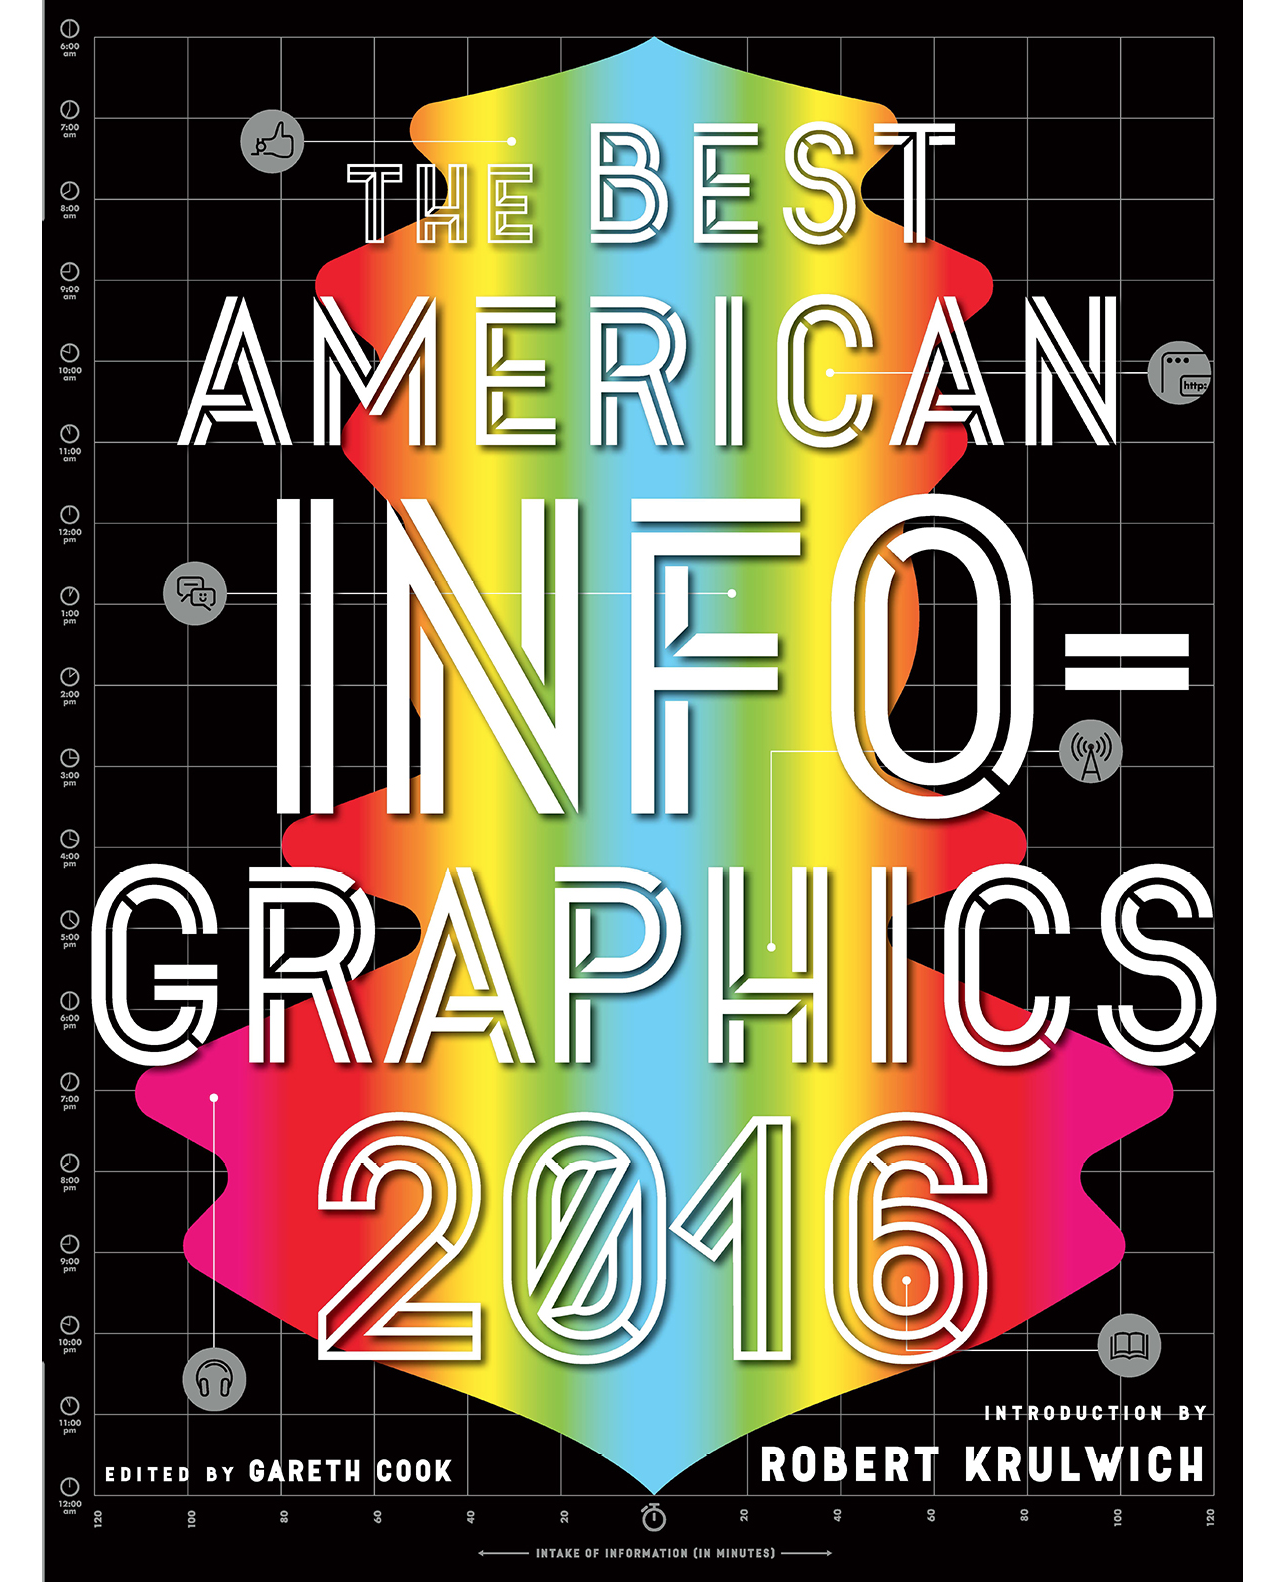


Introduced by Robert Krulwich of Radiolab fame, the years most awesome ( RedOrbit ) infographics reveal aspects of our world in often startling ways from a haunting graphic mapping the journey of 15,790 slave ships over years, to a yearlong series of postcards that records and cements a transatlantic friendship.
The Best American Infographics 2016 covers the realms of social issues, health, sports, arts and culture, and politics including crisp visual data on the likely Democratic/Republican lean- ings of an array of professions (proving that your urologist is far more likely to be a Repub- lican than your pediatrician). Here once again are the most innovative print and electronic infographics the full spectrum of the genre from authoritative to playful ( Scientific American ).

Copyright 2016 by Houghton Mifflin Harcourt Publishing Company
Foreword copyright 2016 by Gareth Cook
Introduction copyright 2016 by Robert Krulwich
All rights reserved
The Best American Series is a registered trademark of Houghton Mifflin Harcourt Publishing Company.
No part of this work may be reproduced or transmitted in any form or by any means, electronic or mechanical, including photocopying and recording, or by any informa- tion storage or retrieval system without the prior written permission of the copyright owner unless such copying is expressly permitted by federal copyright law. With the exception of nonprofit transcription in Braille, Houghton Mifflin Harcourt is not au- thorized to grant permission for further use of copyrighted selections reprinted in this book without the permission of their owners. Permission must be obtained from the individual copyright owners identified herein. Address requests for permission to make copies of Houghton Mifflin Harcourt material to Permissions, Houghton Mifflin Harcourt Publishing Company, Park Avenue, 19th Floor, New York, New York 10016.
www.hmhco.com
Library of Congress Cataloging-in-Publication Data is available.
ISBN 978-0-544-55638-6
The text is set in Eames Century Modern designed by Erik van Blokland and House Industries. All three styles of Epilepsja (fill, outline, and solid) are used as the display typeface. It was designed by Mikoaj Grabowski. Book design by Mark Robinson.
eISBN 978-0-544-86708-6
Permissions credits are located on page .
i
ii
Vi
ViII
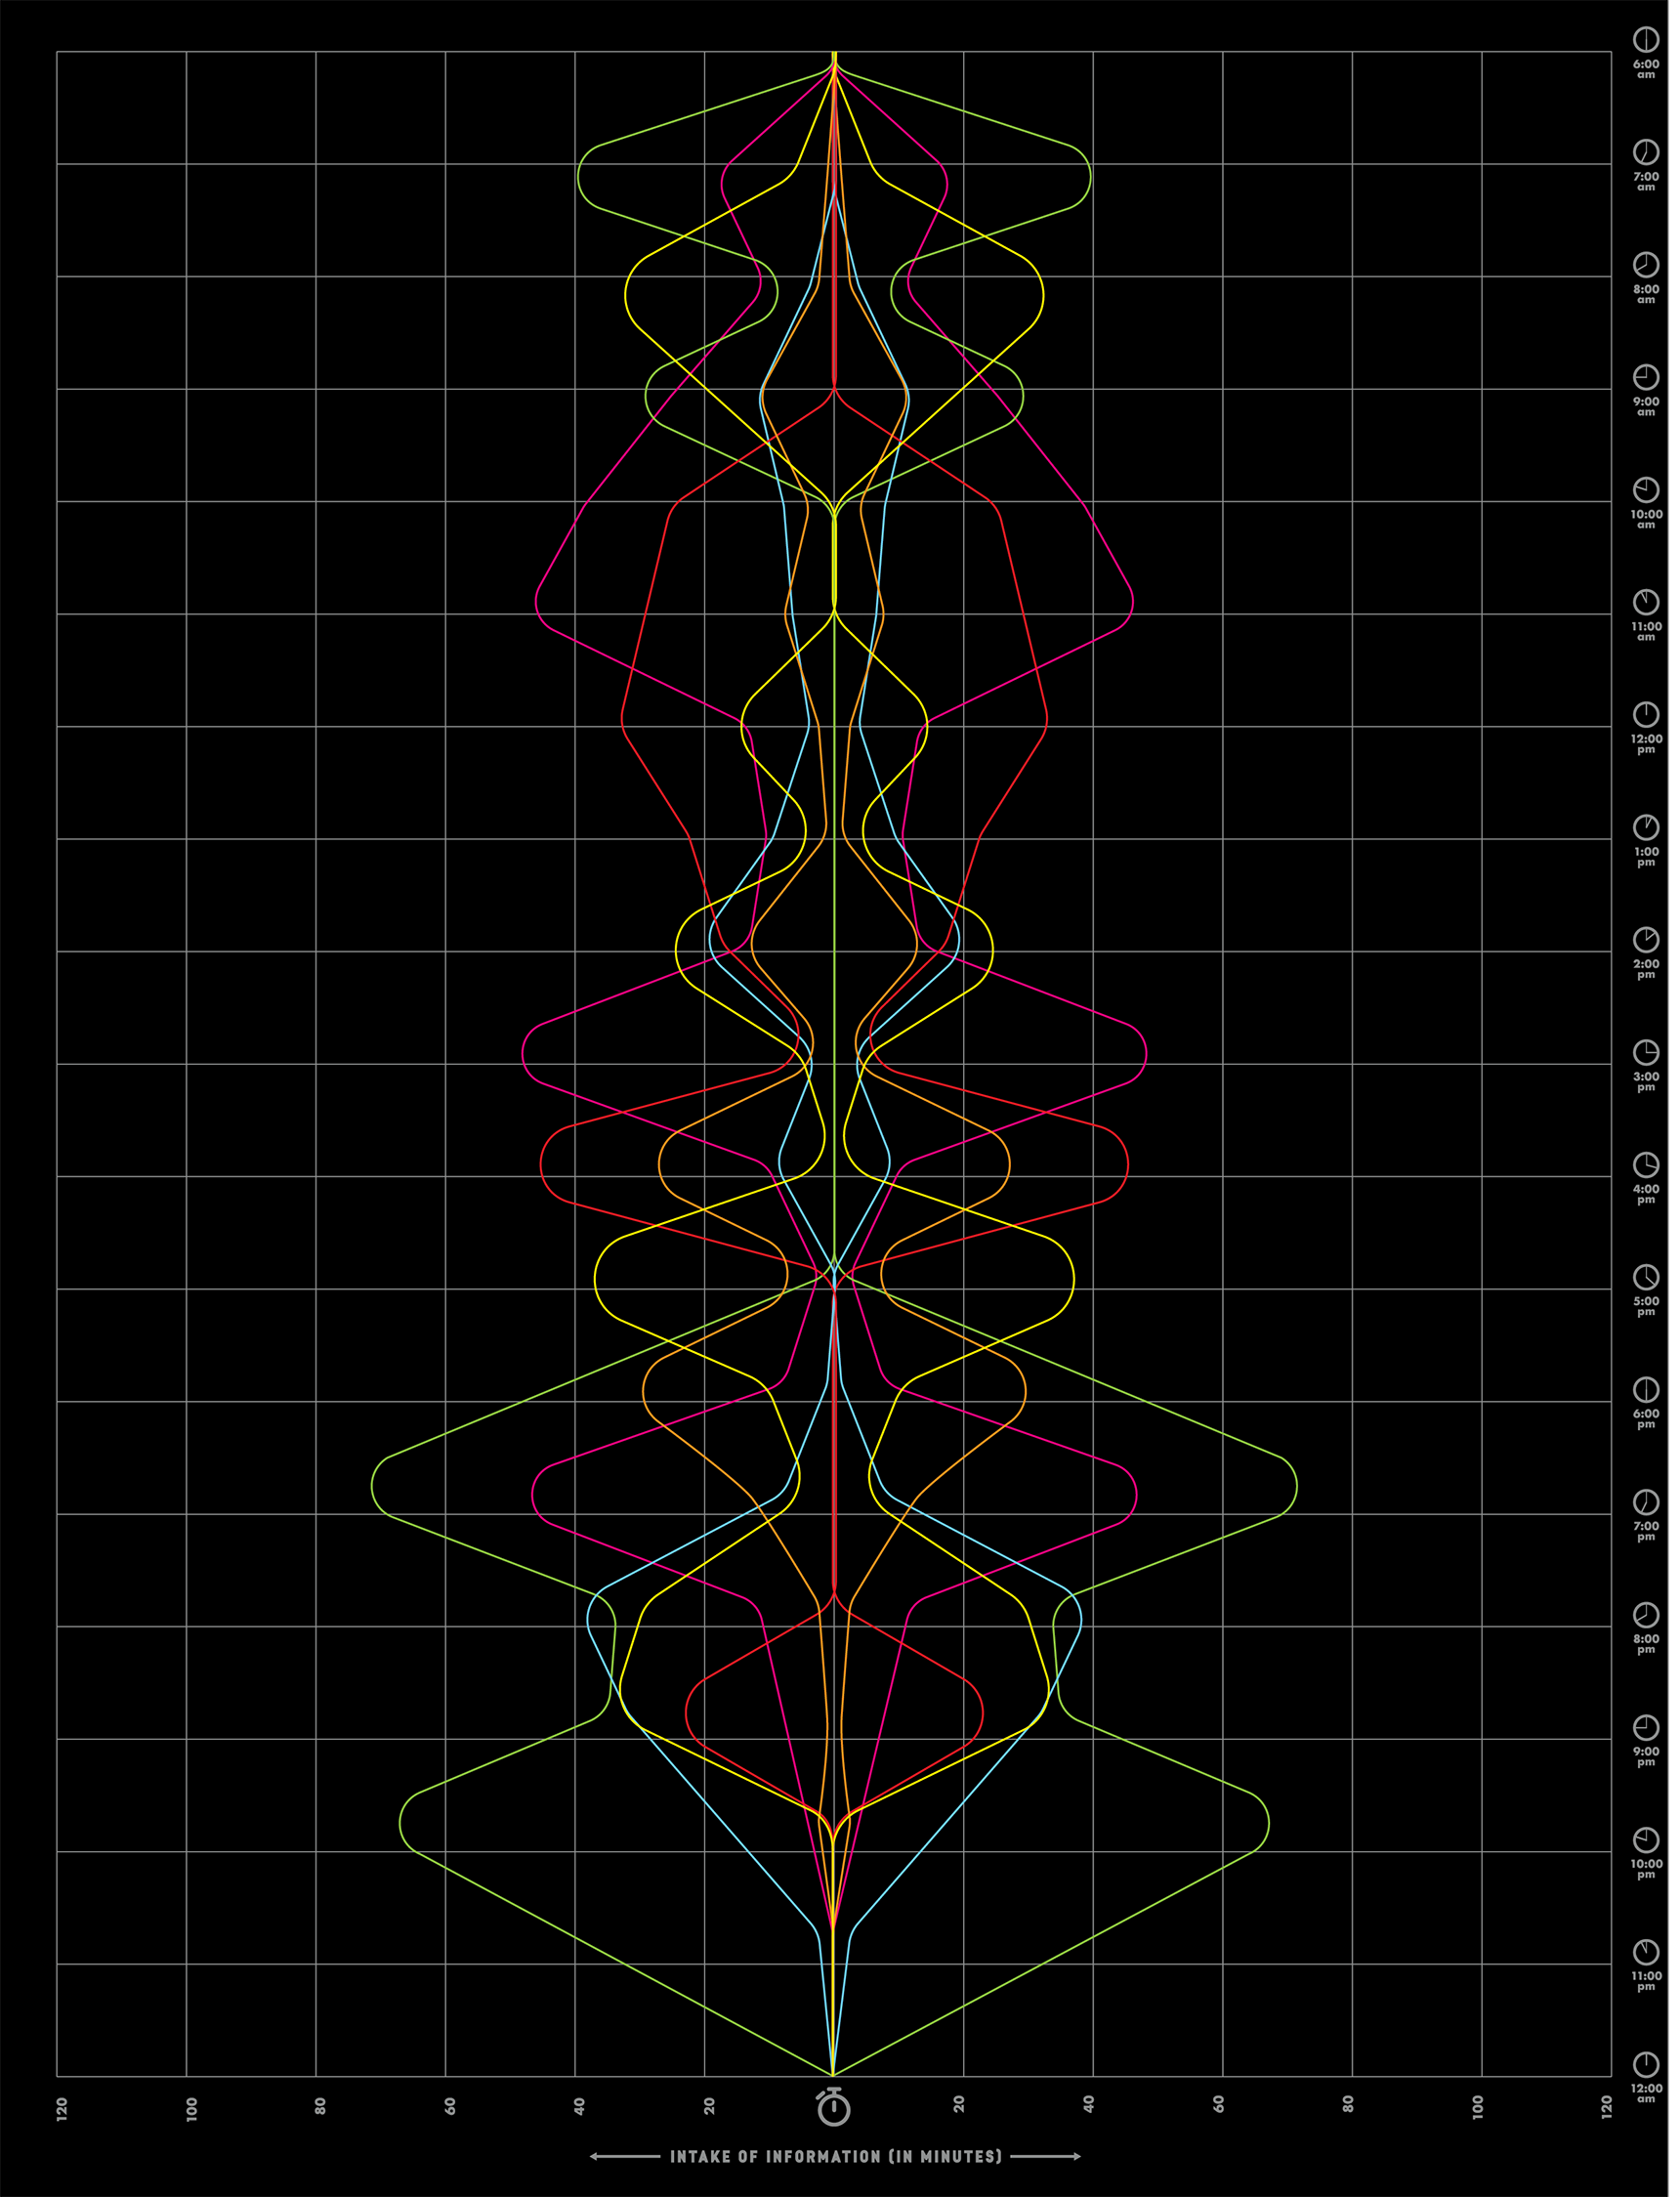
Giorgia Lupi and Stefanie Posavec dear-data.com
Mark Edmond verdantlabs.com
Nathan Yau flowingdata.com
John Tomanio, Bryan Christie, and Shelley Sperry National Geographic
Philip Bump Washington Post
Patterson Clark and Lazaro Gamio Washington Post
Christopher Cannon, Adam Pearce, and Alex McIntyre Bloomberg.com
Rossano Schifanella, Daniele Quercia, and Luca Aiello goodcitylife.org
Gareth Cook
Robert Krulwich
X
xII
you
Contents

Nathan Yau flowingdata.com
Alvin Chang Vox
Andrew Van Dam and Renee Lightner Wall Street Journal
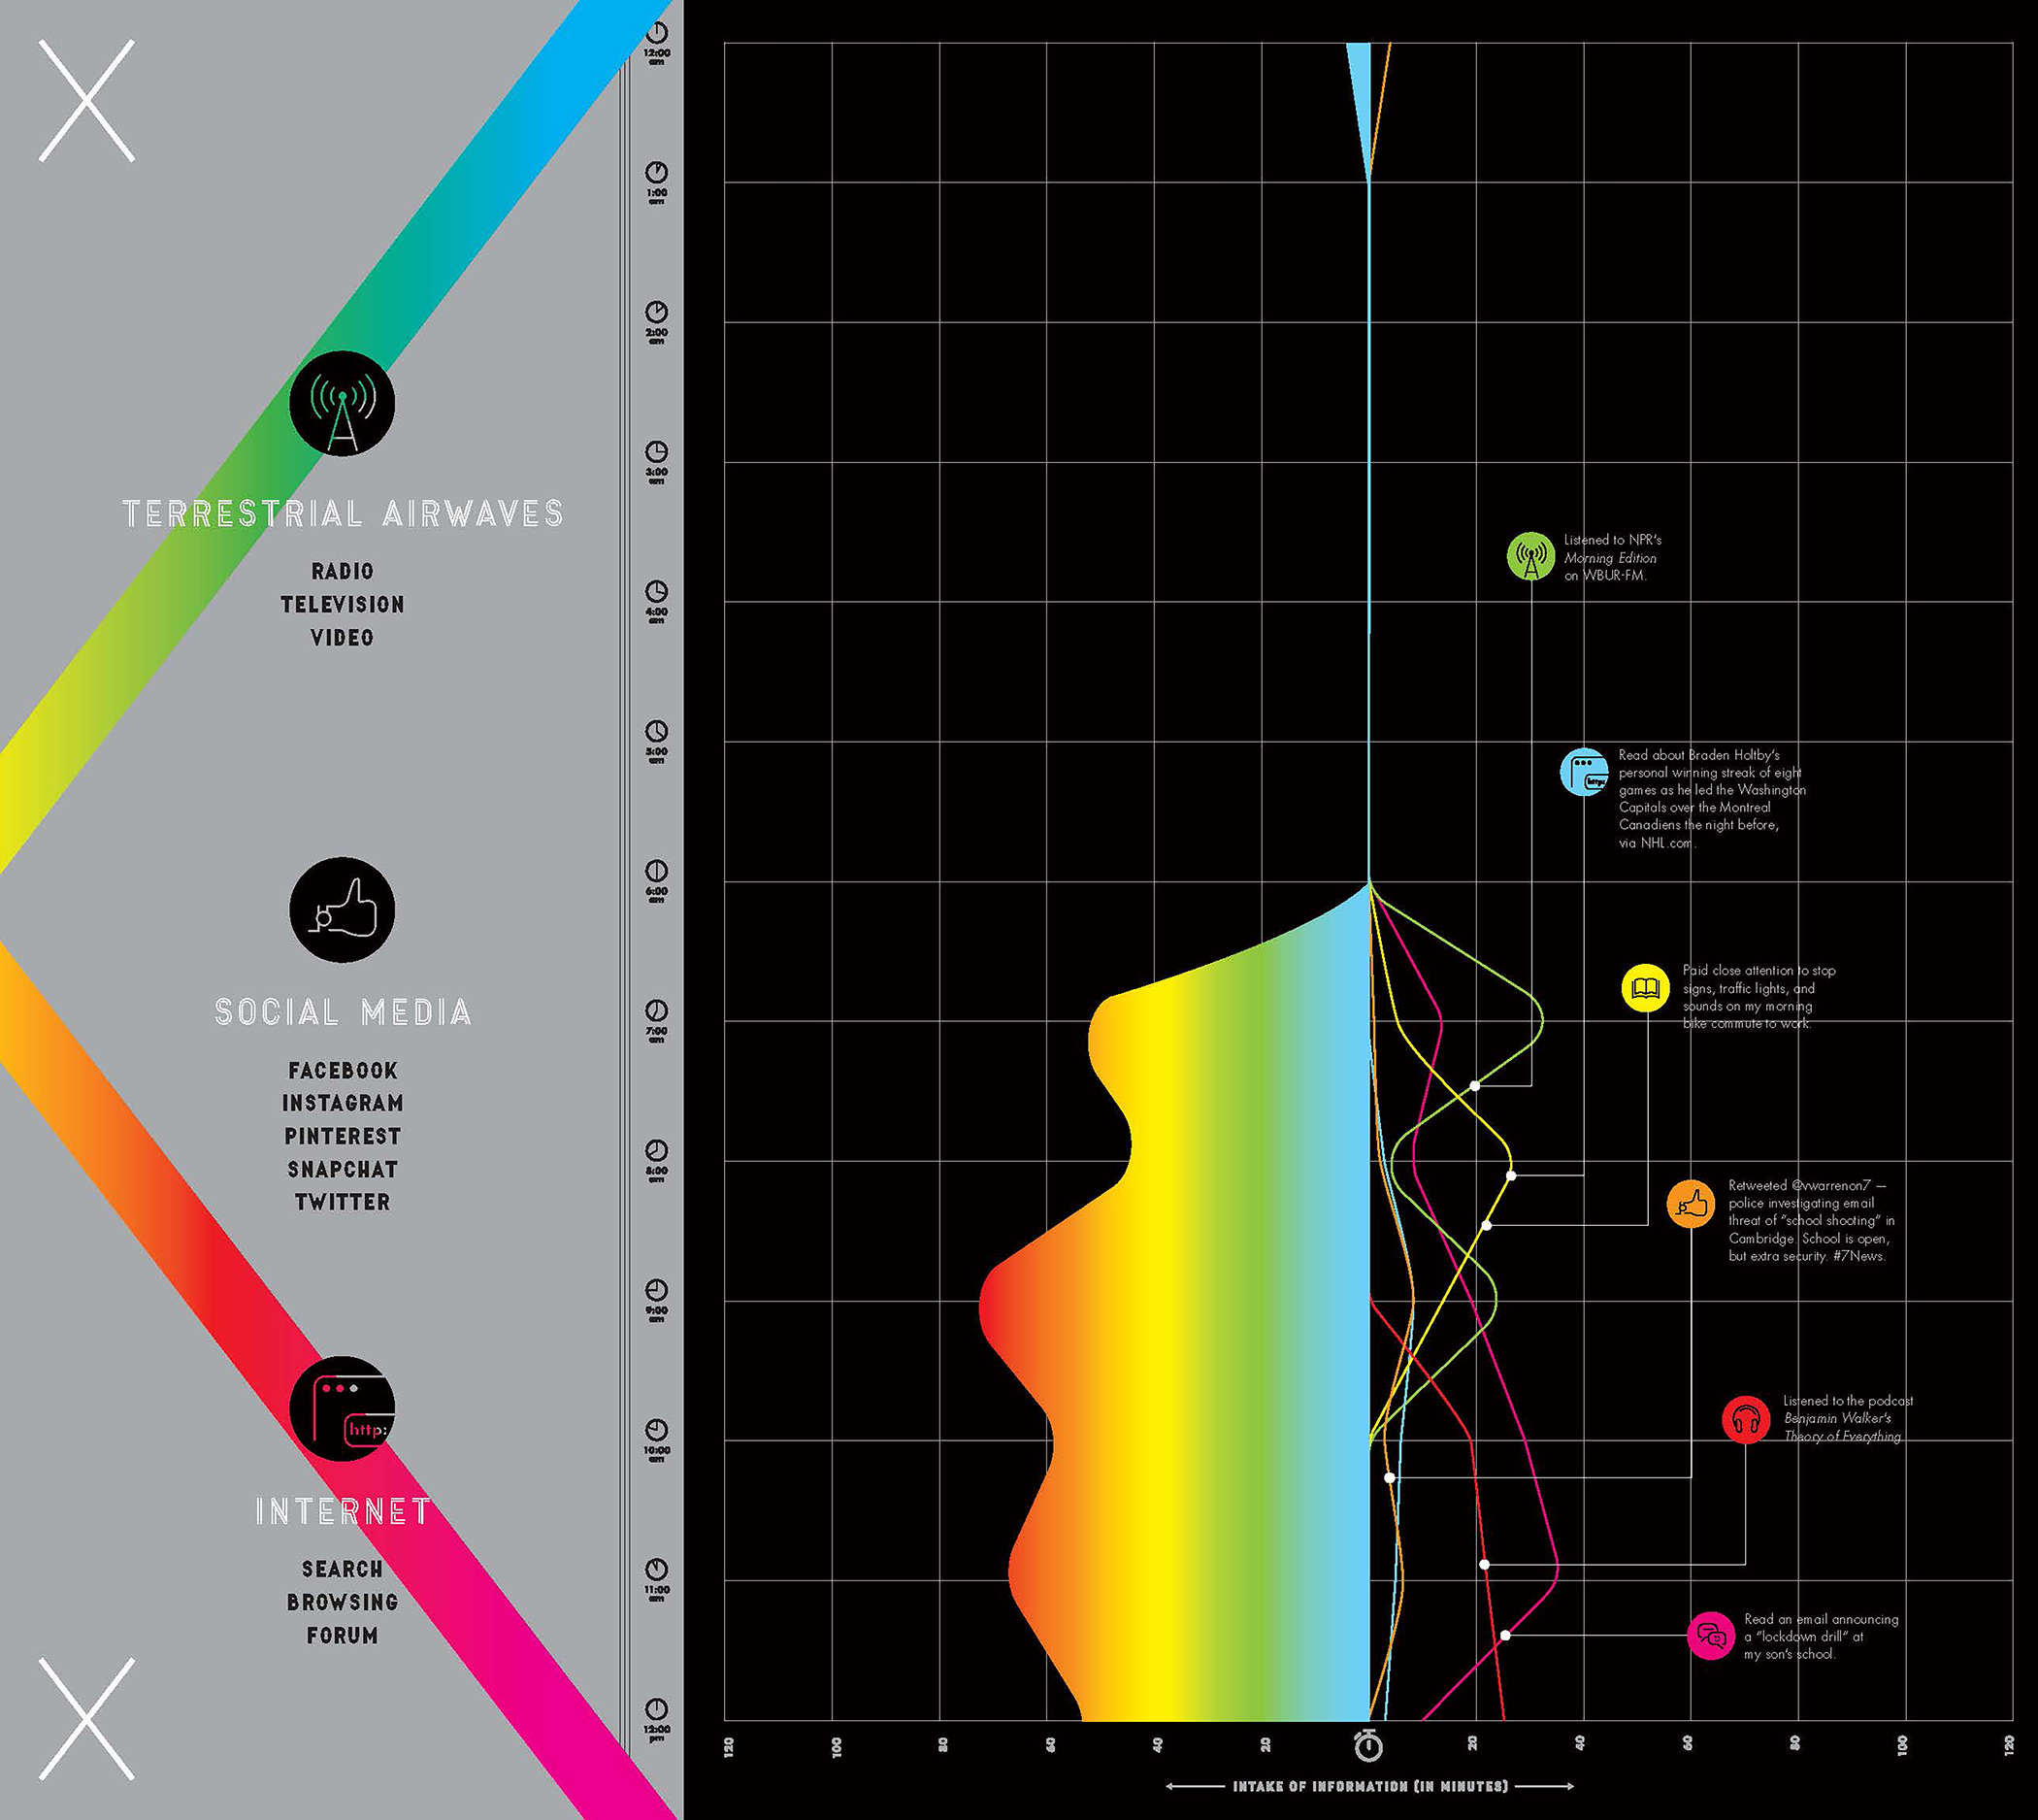
Nicholas Felton feltron.com
Mauro Martino, Clio Andris, and David Lee PLOS ONE
Wilson Andrews, Amanda Cox, Evan Grothjan, Yuliya Parshina-Kottas, Graham Roberts, and Karen Yourish New York Times
Karishma Sheth, Thomas Alberty, Marvin Orellana, Jody Quon, Ian Epstein, Christopher Bonanos, and Adam Moss New York
Stuart A. Thompson, Palani Kumanan, and Jim Chairusmi Wall Street Journal
U S
Korwin Briggs veritablehokum.com
John Nelson uxblog.idvsolutions.com
Tynan DeBold and Dov Friedman Wall Street Journal
Martin Gamache, Kelsey Nowakowski, Heidi Schultz, David Whitmore, and Noah Urban National Geographic
Jer Thorp, Noa Younse, Genevieve Hoffman, Ellery Royston, Jen Christiansen, Gary Stix, and Clara Moskowitz Scientific American
Josh Katz New York Times
Ed Johnson, Elaine Ayo, Amanda Silverman, Josef Reyes, and Mindy Kay Bricker Foreign Policy
Shelly Tan and Alberto Cuadra Washington Post
Various US presidents, various cartoonists, Samuel Granados, and Bonnie Berkowitz Washington Post
Elliott Ramos Wall Street Journal
Valerio Pellegrini and Emily Newhook mha.gwu.edu/climate-change-emissions-data/
Natalia Bronshtein insightfulinteraction.com
Forest Gregg, Cathy Deng, Derek Eder, Eric van Zanten, Daniel Cooper, and Ryan Lugalia-Hollon chicagosmilliondollarblocks.com
Randall Munroe xkcd
Richard Johnson, Tim Curran, Kevin Uhrmacher, Brian Cleveland, and Laris Karklis Washington Post
Bill Rankin radicalcartography.net
Neil Halloran and Andy Dollerson fallen.io
David Taylor Canadian Music Blog
Doug McCune deviantcartography.com
Kristin Lenz, Bobbie Gossage, and Jennifer Alsever Inc.
Justin Palmer labratrevenge.com
Paul North, Chloe Williamson, William Hughes, and Baker Wilcox biggroup.co.uk
Bill Marsh and Kate Zernike New York Times
Font size:
Interval:
Bookmark:
Similar books «The Best American Infographics 2016»
Look at similar books to The Best American Infographics 2016. We have selected literature similar in name and meaning in the hope of providing readers with more options to find new, interesting, not yet read works.
Discussion, reviews of the book The Best American Infographics 2016 and just readers' own opinions. Leave your comments, write what you think about the work, its meaning or the main characters. Specify what exactly you liked and what you didn't like, and why you think so.