Murray Dick - The Infographic: A History of Data Graphics in News and Communications
Here you can read online Murray Dick - The Infographic: A History of Data Graphics in News and Communications full text of the book (entire story) in english for free. Download pdf and epub, get meaning, cover and reviews about this ebook. year: 2020, publisher: The MIT Press, genre: Romance novel. Description of the work, (preface) as well as reviews are available. Best literature library LitArk.com created for fans of good reading and offers a wide selection of genres:
Romance novel
Science fiction
Adventure
Detective
Science
History
Home and family
Prose
Art
Politics
Computer
Non-fiction
Religion
Business
Children
Humor
Choose a favorite category and find really read worthwhile books. Enjoy immersion in the world of imagination, feel the emotions of the characters or learn something new for yourself, make an fascinating discovery.

- Book:The Infographic: A History of Data Graphics in News and Communications
- Author:
- Publisher:The MIT Press
- Genre:
- Year:2020
- Rating:3 / 5
- Favourites:Add to favourites
- Your mark:
The Infographic: A History of Data Graphics in News and Communications: summary, description and annotation
We offer to read an annotation, description, summary or preface (depends on what the author of the book "The Infographic: A History of Data Graphics in News and Communications" wrote himself). If you haven't found the necessary information about the book — write in the comments, we will try to find it.
An exploration of infographics and data visualization as a cultural phenomenon, from eighteenth-century print culture to todays data journalism.
Infographics and data visualization are ubiquitous in our everyday media diet, particularly in news--in print newspapers, on television news, and online. It has been argued that infographics are changing what it means to be literate in the twenty-first century--and even that they harmonize uniquely with human cognition. In this first serious exploration of the subject, Murray Dick traces the cultural evolution of the infographic, examining its use in news--and resistance to its use--from eighteenth-century print culture to todays data journalism. He identifies six historical phases of infographics in popular culture: the proto-infographic, the classical, the improving, the commercial, the ideological, and the professional.
Dick describes the emergence of infographic forms within a wider history of journalism, culture, and communications, focusing his analysis on the UK. He considers their use in the partisan British journalism of late eighteenth and early nineteenth-century print media; their later deployment as a vehicle for reform and improvement; their mass-market debut in the twentieth century as a means of explanation (and sometimes propaganda); and their use for both ideological and professional purposes in the post-World War II marketized newspaper culture. Finally, he proposes best practices for news infographics and defends infographics and data visualization against a range of criticism. Dick offers not only a history of how the public has experienced and understood the infographic, but also an account of what data visualization can tell us about the past.
Murray Dick: author's other books
Who wrote The Infographic: A History of Data Graphics in News and Communications? Find out the surname, the name of the author of the book and a list of all author's works by series.


![Scott Murray [Scott Murray] - Interactive Data Visualization for the Web, 2nd Edition](/uploads/posts/book/120518/thumbs/scott-murray-scott-murray-interactive-data.jpg)


The Infographic: A History of Data Graphics in News and Communications — read online for free the complete book (whole text) full work
Below is the text of the book, divided by pages. System saving the place of the last page read, allows you to conveniently read the book "The Infographic: A History of Data Graphics in News and Communications" online for free, without having to search again every time where you left off. Put a bookmark, and you can go to the page where you finished reading at any time.
Font size:
Interval:
Bookmark:
History and Foundations of Information Science
Edited by Michael Buckland, Jonathan Furner, and Markus Krajewski
Human Information Retrieval by Julian Warner
Good Faith Collaboration: The Culture of Wikipedia by Joseph Michael Reagle Jr.
Paper Machines: About Cards & Catalogs, 15481929 by Markus Krajewski, translated by Peter Krapp
Information and Intrigue: From Index Cards to Dewey Decimals to Alger Hiss by Colin B. Burke
Indexing It All: The Subject in the Age of Documentation, Information, and Data by Ronald E. Day
Bibliometrics and Research Evaluation: The Good, the Bad, and the Ugly by Yves Gingras
Search Foundations: Toward a Science of Technology-Mediated Experience by Sachi Arafat and Elham Ashoori
The Information Manifold: A New Perspective on Algorithmic Bias, Fake News, and the False Hope That Computers Can Solve These Problems by Antonio Badia
Documentarity: Evidence, Ontology, and Inscription by Ronald E. Day
The Infographic: A History of Data Graphics in News and Communications by Murray Dick
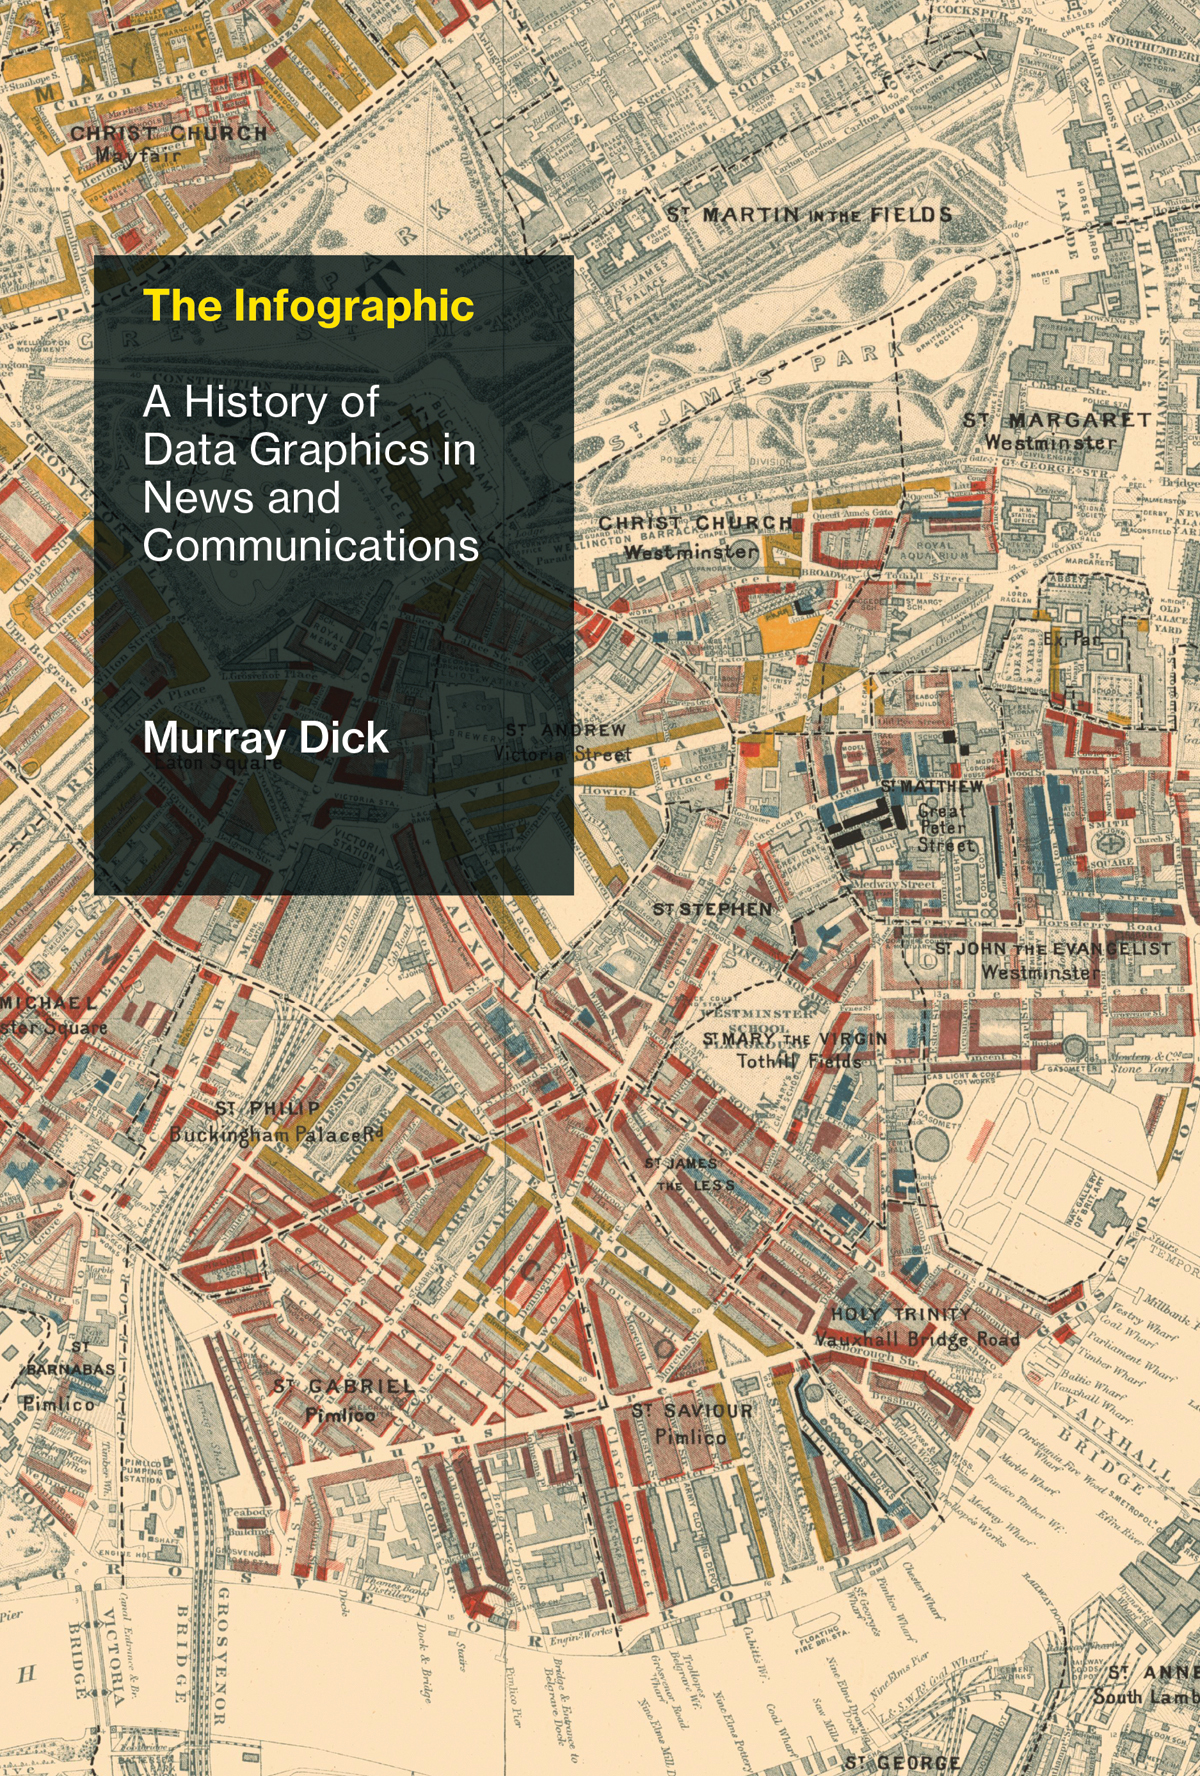
The Infographic
A History of Data Graphics in News and Communications
Murray Dick
The MIT Press
Cambridge, Massachusetts
London, England
2020 Massachusetts Institute of Technology
All rights reserved. No part of this book may be reproduced in any form by any electronic or mechanical means (including photocopying, recording, or information storage and retrieval) without permission in writing from the publisher.
Library of Congress Cataloging-in-Publication Data
Names: Dick, Murray, author.
Title: The infographic : a history of data graphics in news and communications / Murray Dick.
Description: Cambridge, Massachuetts : The MIT Press, 2020. | Series: History and foundations of information science | Includes bibliographical references and index.
Identifiers: LCCN 2019029382 | ISBN 9780262043823 (hardcover)
Subjects: LCSH: Journalism--Data processing. | Journalism--Technological innovations. | Information visualization. | Visual communication.
Classification: LCC PN4784.E5 D53 2020 | DDC 001.4/226--dc23
LC record available at https://lccn.loc.gov/2019029382
d_r0
For Keir, Tam and Effie.
List of Figures
Daily Express, June 4, 1959, 8. Reproduced by permission of Reach plc.
tell a very different story.
A specimen of Priestleys A Chart of Biography, in J. Priestley, A Description of a Chart of Biography (Warrington: Warrington Academy, 1765b).
J. Priestley, A New Chart of History (Warrington: Warrington, 1769b).
Exports and Imports of Scotland to and from different parts for one Year from Christmas 1780 to Christmas 1781, in W. Playfair, The Commercial and Political Atlas, third edition (London: J. Corry, 1801a [1786]).
Chart of the National Debt of England, in W. Playfair, The Commercial and Political Atlas, third edition (London: J. Corry, 1801a [1786]).
Statistical Chart Showing the Extent of the Population and Revenues of the Principal Nations of Europe in the order of their Magnitude, in W. Playfair, An Inquiry into the Permanent Causes of the Decline and Fall of Powerful and Wealthy Nations (London: Greenland & Norris, 1805a).
A multivariate linear display from Playfairs experimental period. Linear Chronology, Exhibiting the Revenues, Expenditure, Debt, Price of Stocks & Bread, from 1770 to 1824, in W. Playfair, Chronology of Public Events and Remarkable Occurrences within the Last Fifty Years (London: G. and W. B. Whittaker, 1824).
Improvident Marriages in England and Wales, those of Males under 21 being so designated, 1844, in J. Fletcher, Summary of the Moral Statistics of England and Wales (London: Privately printed, 1849?), plate IX.
Geographical Distribution of Drunkenness. England and Wales, in J. Rowntree and A. Sherwell, The Temperance Problem and Social Reform (London: Hodder and Stoughton, 1899).
W. Farr, Annual Report of the Registrar-General of Births, Deaths, and Marriages in England and Wales, fifth report (London: H.M.S.O, 1843), 51.
Diagrams of the Mortality in the Army in the East, in F. Nightingale, A Contribution to the Sanitary History of the British Army during the Late War with Russia (London: John W. Parker, 1859). Credit: Wellcome Collection.
Diagram of the Causes of Mortality in the Army in the East, in F. Nightingale, A Contribution to the Sanitary History of the British Army during the Late War with Russia (London: John W. Parker, 1859). Credit: Wellcome Collection.
Diagram Representing the Mortality in the Hospitals at Scutari and Kulali, from October 01 1854 to September 30 1855, in F. Nightingale, A Contribution to the Sanitary History of the British Army during the Late War with Russia (London: John W. Parker, 1859). Credit: Wellcome Collection.
Map Showing the Number of Persons Committed for Keeping Disorderly Houses in Every 10,000,000 of the Population, in the Several Counties of England and Wales, in H. Mayhew, London Labour and the London Poor, vol. 4 (London: Woodfall, 1862).
C. Booth, Map Descriptive of London Poverty, 18981899, Sheet 7 (Inner Western Central District), in C. Booth, Life and Labour of the People in London. Final volume, Notes on social influence and conclusion. (London: Macmillan & Co., 1902).
M. G. Mulhall, Mulhalls Dictionary of Statistics, third edition (London: G. Routledge and Sons, 1892 [1886]), plate IX.
What Different Nations Eat and Drink, areni svjetski koledar [Colourful world calander] (Winterberg, Bohemia: J. Steinbrener, 1901), 8182.
A Prime Cause of High Prices: Huge Increases in Wages, in the Illustrated London News, August 16, 1919, 5.
It will not be want of money : Britains Huge Effort, in the Illustrated London News, August 11, 1917, 16.
The Navel expenditure of the Powers: Ever-Growing Figures, in the Illustrated London News, February 7, 1914, 5.
The Winding Stream of Party Politics: Elections Since 1832, in the Illustrated London News, November 8, 1924, 12.
The Dryness of Last Winter Compared With the Past Thirty Winters, The Sphere, July 20, 1901, 18.
The Awesome Summer of 1911 Analysed, The Sphere, November 4, 1911, 16.
The Loss of the Titanic. The Results Analysed and Shown in a Special Sphere Diagram, The Sphere, May 4, 1912, 19.
Daily Mail, World Map of War and Commerce (London: London Geographical Institute, ca. 1917).
A Worried Mans Day in Daily Mail, June 27, 1905, 9.
Circulation chart, Daily Illustrated Mirror, February 27, 1904, 1. Reproduced by permission of Mary Evans Picture Library Ltd.
Phillip Zec, Putting Paid to Adolf!, Daily Mirror, February 6, 1941, 5. Reproduced by permission of Reach plc.
In A. J. Liversedge, Twenty-one years of coal in the United Kingdom, the United States, and Germany Shown at a Glance in Eight Graphs, Financial Times, August 10, 1921, 3.
From the Dundee Advertiser, January 4, 1886, 3.
From the Dundee Courier & Argus, January 12, 1900, 7.
From Albert A. Hopkins & R. A. Bond, Scientific American Reference Book (New York: Munn & Company Publishers, 1899), 117136.
Font size:
Interval:
Bookmark:
Similar books «The Infographic: A History of Data Graphics in News and Communications»
Look at similar books to The Infographic: A History of Data Graphics in News and Communications. We have selected literature similar in name and meaning in the hope of providing readers with more options to find new, interesting, not yet read works.
Discussion, reviews of the book The Infographic: A History of Data Graphics in News and Communications and just readers' own opinions. Leave your comments, write what you think about the work, its meaning or the main characters. Specify what exactly you liked and what you didn't like, and why you think so.