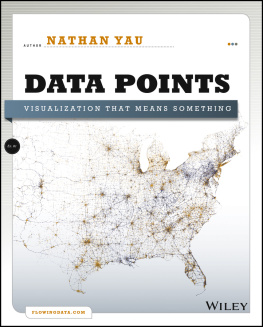
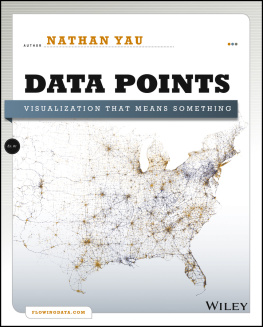
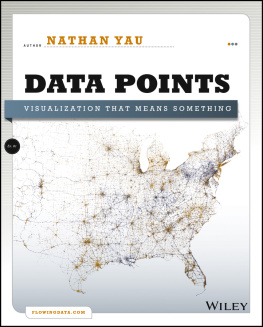
Yau - Data points: visualization that means something
Here you can read online Yau - Data points: visualization that means something full text of the book (entire story) in english for free. Download pdf and epub, get meaning, cover and reviews about this ebook. City: Indianapolis, year: 2013, publisher: Wiley Publishing, Inc.;John Wiley & Sons, genre: Politics. Description of the work, (preface) as well as reviews are available. Best literature library LitArk.com created for fans of good reading and offers a wide selection of genres:
Romance novel
Science fiction
Adventure
Detective
Science
History
Home and family
Prose
Art
Politics
Computer
Non-fiction
Religion
Business
Children
Humor
Choose a favorite category and find really read worthwhile books. Enjoy immersion in the world of imagination, feel the emotions of the characters or learn something new for yourself, make an fascinating discovery.
Data points: visualization that means something: summary, description and annotation
We offer to read an annotation, description, summary or preface (depends on what the author of the book "Data points: visualization that means something" wrote himself). If you haven't found the necessary information about the book — write in the comments, we will try to find it.
Yau: author's other books
Who wrote Data points: visualization that means something? Find out the surname, the name of the author of the book and a list of all author's works by series.
Data points: visualization that means something — read online for free the complete book (whole text) full work
Below is the text of the book, divided by pages. System saving the place of the last page read, allows you to conveniently read the book "Data points: visualization that means something" online for free, without having to search again every time where you left off. Put a bookmark, and you can go to the page where you finished reading at any time.
Font size:
Interval:
Bookmark:
Executive Editor:
Carol Long
Senior Project Editor:
Adaobi Obi Tulton
Technical Editor:
Jen Lowe
Production Editor:
Kathleen Wisor
Copy Editor:
Apostrophe Editing Services
Editorial Manager:
Mary Beth Wakefield
Freelancer Editorial Manager:
Rosemarie Graham
Associate Director of Marketing:
David Mayhew
Marketing Manager:
Ashley Zurcher
Business Manager:
Amy Knies
Production Manager:
Tim Tate
Vice President and Executive Group Publisher:
Richard Swadley
Vice President and Executive Publisher:
Neil Edde
Associate Publisher:
Jim Minatel
Project Coordinator, Cover:
Katie Crocker
Compositor:
James D. Kramer, Happenstance Type-O-Rama
Proofreader:
James Saturino, Word One
Indexer:
Johnna VanHoose Dinse
Cover Designer:
Ryan Sneed
Cover Image:
Nathan Yau
Chapter Photographs:
Serena Yau
Published by
John Wiley & Sons, Inc.
10475 Crosspoint Boulevard
Indianapolis, IN 46256
www.wiley.com
Copyright 2013 by John Wiley & Sons, Inc., Indianapolis, Indiana
Published simultaneously in Canada
ISBN: 978-1-118-46219-5
ISBN: 978-1-118-46222-5 (ebk)
ISBN: 978-1-118-65493-4 (ebk)
ISBN: 978-1-118-65493-4 (ebk)
Manufactured in the United States of America
10 9 8 7 6 5 4 3 2 1
No part of this publication may be reproduced, stored in a retrieval system or transmitted in any form or by any means, electronic, mechanical, photocopying, recording, scanning or otherwise, except as permitted under Sections 107 or 108 of the 1976 United States Copyright Act, without either the prior written permission of the Publisher, or authorization through payment of the appropriate per-copy fee to the Copyright Clearance Center, 222 Rosewood Drive, Danvers, MA 01923, (978) 750-8400, fax (978) 646-8600. Requests to the Publisher for permission should be addressed to the Permissions Department, John Wiley & Sons, Inc., 111 River Street, Hoboken, NJ 07030, (201) 748-6011, fax (201) 748-6008, or online at http://www.wiley.com/go/permissions .
Limit of Liability/Disclaimer of Warranty: The publisher and the author make no representations or warranties with respect to the accuracy or completeness of the contents of this work and specifically disclaim all warranties, including without limitation warranties of fitness for a particular purpose. No warranty may be created or extended by sales or promotional materials. The advice and strategies contained herein may not be suitable for every situation. This work is sold with the understanding that the publisher is not engaged in rendering legal, accounting, or other professional services. If professional assistance is required, the services of a competent professional person should be sought. Neither the publisher nor the author shall be liable for damages arising herefrom. The fact that an organization or Web site is referred to in this work as a citation and/or a potential source of further information does not mean that the author or the publisher endorses the information the organization or website may provide or recommendations it may make. Further, readers should be aware that Internet websites listed in this work may have changed or disappeared between when this work was written and when it is read.
For general information on our other products and services please contact our Customer Care Department within the United States at (877) 762-2974, outside the United States at (317) 572-3993 or fax (317) 572-4002.
Wiley publishes in a variety of print and electronic formats and by print-on-demand. Some material included with standard print versions of this book may not be included in e-books or in print-on-demand. If this book refers to media such as a CD or DVD that is not included in the version you purchased, you may download this material at http://booksupport.wiley.com . For more information about Wiley products, visit www.wiley.com .
Library of Congress Control Number: 2012956416
Trademarks: Wiley and the Wiley logo are trademarks or registered trademarks of John Wiley & Sons, Inc. and/or its affiliates, in the United States and other countries, and may not be used without written permission. All other trademarks are the property of their respective owners. John Wiley & Sons, Inc. is not associated with any product or vendor mentioned in this book.
To Bea
Nathan Yau has written and created graphics for FlowingData since 2007, a site on visualization, statistics, and design and believes that visualization is a medium that can be used as both a tool and a way to express data. He is the author of Visualize This: The FlowingData Guide to Design, Visualization, and Statistics, also published by Wiley.
Yau has a masters degree in statistics from the University of California, Los Angeles, and has a Ph.D. in statistics with a focus on visualization and personal data. He is a statistician.
Jen Lowe is an Associate Research Scholar at the Spatial Information Design Lab at Columbia University where she experiments with new forms of data visualization and communication. She has a bachelors degree in applied mathematics and a masters degree in information science. She has publications in applied meteorology and astronomy in journals such as the Journal of Atmospheric and Oceanic Technology, and has spoken internationally on the relationship between data, visualization, and identity. A sucker for a good argument, shell nearly always side with complexity.
Thank you to everyone I spoke to and received feedback from in the process of writing this book. You provided valuable insight and gave me fresh perspectives. Thank you to those who graciously let me feature their beautiful work.
Thank you to FlowingData readers who continue to support and always give me something to be excited about. This book would not exist without you.
Thank you to Wiley Publishing for helping me write a book worth reading and to Jen Lowe for making sure my words meant something.
Thank you to Serena Yau for taking pictures.
Thank you to the statisticians, computer scientists, data scientists, designers, and everyone else involved in this hodge-podge data world for making it fun and always keeping it interesting.
Thank you to all those who have taught me.
Thank you to my wife, my parents, and all other family and friends for their support and encouragement.
What is good visualization? It is a representation of data that helps you see what you otherwise would have been blind to if you looked only at the naked source. It enables you to see trends, patterns, and outliers that tell you about yourself and what surrounds you. The best visualization evokes that moment of bliss when seeing something for the first time, knowing that what you see has been right in front of you, just slightly hidden. Sometimes it is a simple bar graph, and other times the visualization is complex because the data requires it.
A data set is a snapshot in time that captures something that moves and changes. Collectively, data points form aggregates and statistical summaries that can tell you what to expect. These are your means, medians, and standard deviations. They describe the world, countries, and populations and enable you to compare and contrast things. When you push down on the data, you get details about the individuals and objects within the population. These are the stories that make a data set human and relatable.
Next pageFont size:
Interval:
Bookmark:
Similar books «Data points: visualization that means something»
Look at similar books to Data points: visualization that means something. We have selected literature similar in name and meaning in the hope of providing readers with more options to find new, interesting, not yet read works.
Discussion, reviews of the book Data points: visualization that means something and just readers' own opinions. Leave your comments, write what you think about the work, its meaning or the main characters. Specify what exactly you liked and what you didn't like, and why you think so.

