Lorna Brown - Tableau Desktop Cookbook
Here you can read online Lorna Brown - Tableau Desktop Cookbook full text of the book (entire story) in english for free. Download pdf and epub, get meaning, cover and reviews about this ebook. year: 2021, publisher: OReilly Media, Inc., genre: Politics. Description of the work, (preface) as well as reviews are available. Best literature library LitArk.com created for fans of good reading and offers a wide selection of genres:
Romance novel
Science fiction
Adventure
Detective
Science
History
Home and family
Prose
Art
Politics
Computer
Non-fiction
Religion
Business
Children
Humor
Choose a favorite category and find really read worthwhile books. Enjoy immersion in the world of imagination, feel the emotions of the characters or learn something new for yourself, make an fascinating discovery.
- Book:Tableau Desktop Cookbook
- Author:
- Publisher:OReilly Media, Inc.
- Genre:
- Year:2021
- Rating:4 / 5
- Favourites:Add to favourites
- Your mark:
- 80
- 1
- 2
- 3
- 4
- 5
Tableau Desktop Cookbook: summary, description and annotation
We offer to read an annotation, description, summary or preface (depends on what the author of the book "Tableau Desktop Cookbook" wrote himself). If you haven't found the necessary information about the book — write in the comments, we will try to find it.
Tableau Desktop Cookbook — read online for free the complete book (whole text) full work
Below is the text of the book, divided by pages. System saving the place of the last page read, allows you to conveniently read the book "Tableau Desktop Cookbook" online for free, without having to search again every time where you left off. Put a bookmark, and you can go to the page where you finished reading at any time.
Font size:
Interval:
Bookmark:

by Lorna Brown
Copyright 2021 Lorna Brown. All rights reserved.
Printed in Canada.
Published by OReilly Media, Inc. , 1005 Gravenstein Highway North, Sebastopol, CA 95472.
OReilly books may be purchased for educational, business, or sales promotional use. Online editions are also available for most titles (http://oreilly.com). For more information, contact our corporate/institutional sales department: 800-998-9938 or corporate@oreilly.com .
- Acquisitions Editor: Angela Rufino
- Development Editor: Michelle Smith
- Production Editor: Katherine Tozer
- Copyeditor: nSight, Inc.
- Proofreader: Sharon Wilkey
- Indexer: nSight, Inc.
- Interior Designer: David Futato
- Cover Designer: Karen Montgomery
- Illustrator: Kate Dullea
- September 2021: First Edition
- 2021-08-02: First Release
See http://oreilly.com/catalog/errata.csp?isbn=9781492090113 for release details.
The OReilly logo is a registered trademark of OReilly Media, Inc. Tableau Desktop Cookbook, the cover image, and related trade dress are trademarks of OReilly Media, Inc.
The views expressed in this work are those of the author, and do not represent the publishers views. While the publisher and the author have used good faith efforts to ensure that the information and instructions contained in this work are accurate, the publisher and the author disclaim all responsibility for errors or omissions, including without limitation responsibility for damages resulting from the use of or reliance on this work. Use of the information and instructions contained in this work is at your own risk. If any code samples or other technology this work contains or describes is subject to open source licenses or the intellectual property rights of others, it is your responsibility to ensure that your use thereof complies with such licenses and/or rights.
978-1-492-09011-3
[MBP]
About six years ago, I was asked to produce a visualization based on data from Microsoft Excel, using software called Tableau. Ill admit I fumbled around a little bit at first. When I had finished creating the visual analysis, I presented that back to stakeholders, and I saw their faces light up. For them, seeing their data in this new visualization enabled them to ask more questions and act on the data they were seeing. Since that light bulb moment, I saw the power of data visualization and wanted to empower others to work with data. But what is data?
Data is all around us. Data is facts and statistics that are collected about something. That could be anythingsales, health and fitness, housing, or flights. Each one of those areas collects data. Data can be stored in many forms, from Excel spreadsheets to databases, and each organization will have a different storage process and many types of data. Without data, we cant create data visualizations. But what is data visualization? I hear you ask.
Data visualization is the visual representation of data points to communicate the messages within your data set more effectively to your audience. Data visualization enables your user to see and understand their data, ask further questions that they couldnt before, and make data-informed decisions from these visualizations.
When there is visual representation of data, like a chart, we can quickly gain insight and spot trends or outliers within the data. Data visualization is more effective when preattentive attributes are used well to communicate with data, because these attributes allow us to process the data almost immediately. If you want to understand more about how to communicate with data, see Carl Allchins Communicating with Data (OReilly, 2021, currently in Early Release).
This book will help you get the most out of following 10 preattentive attributes, which you need to be aware of before creating any data visualizations:
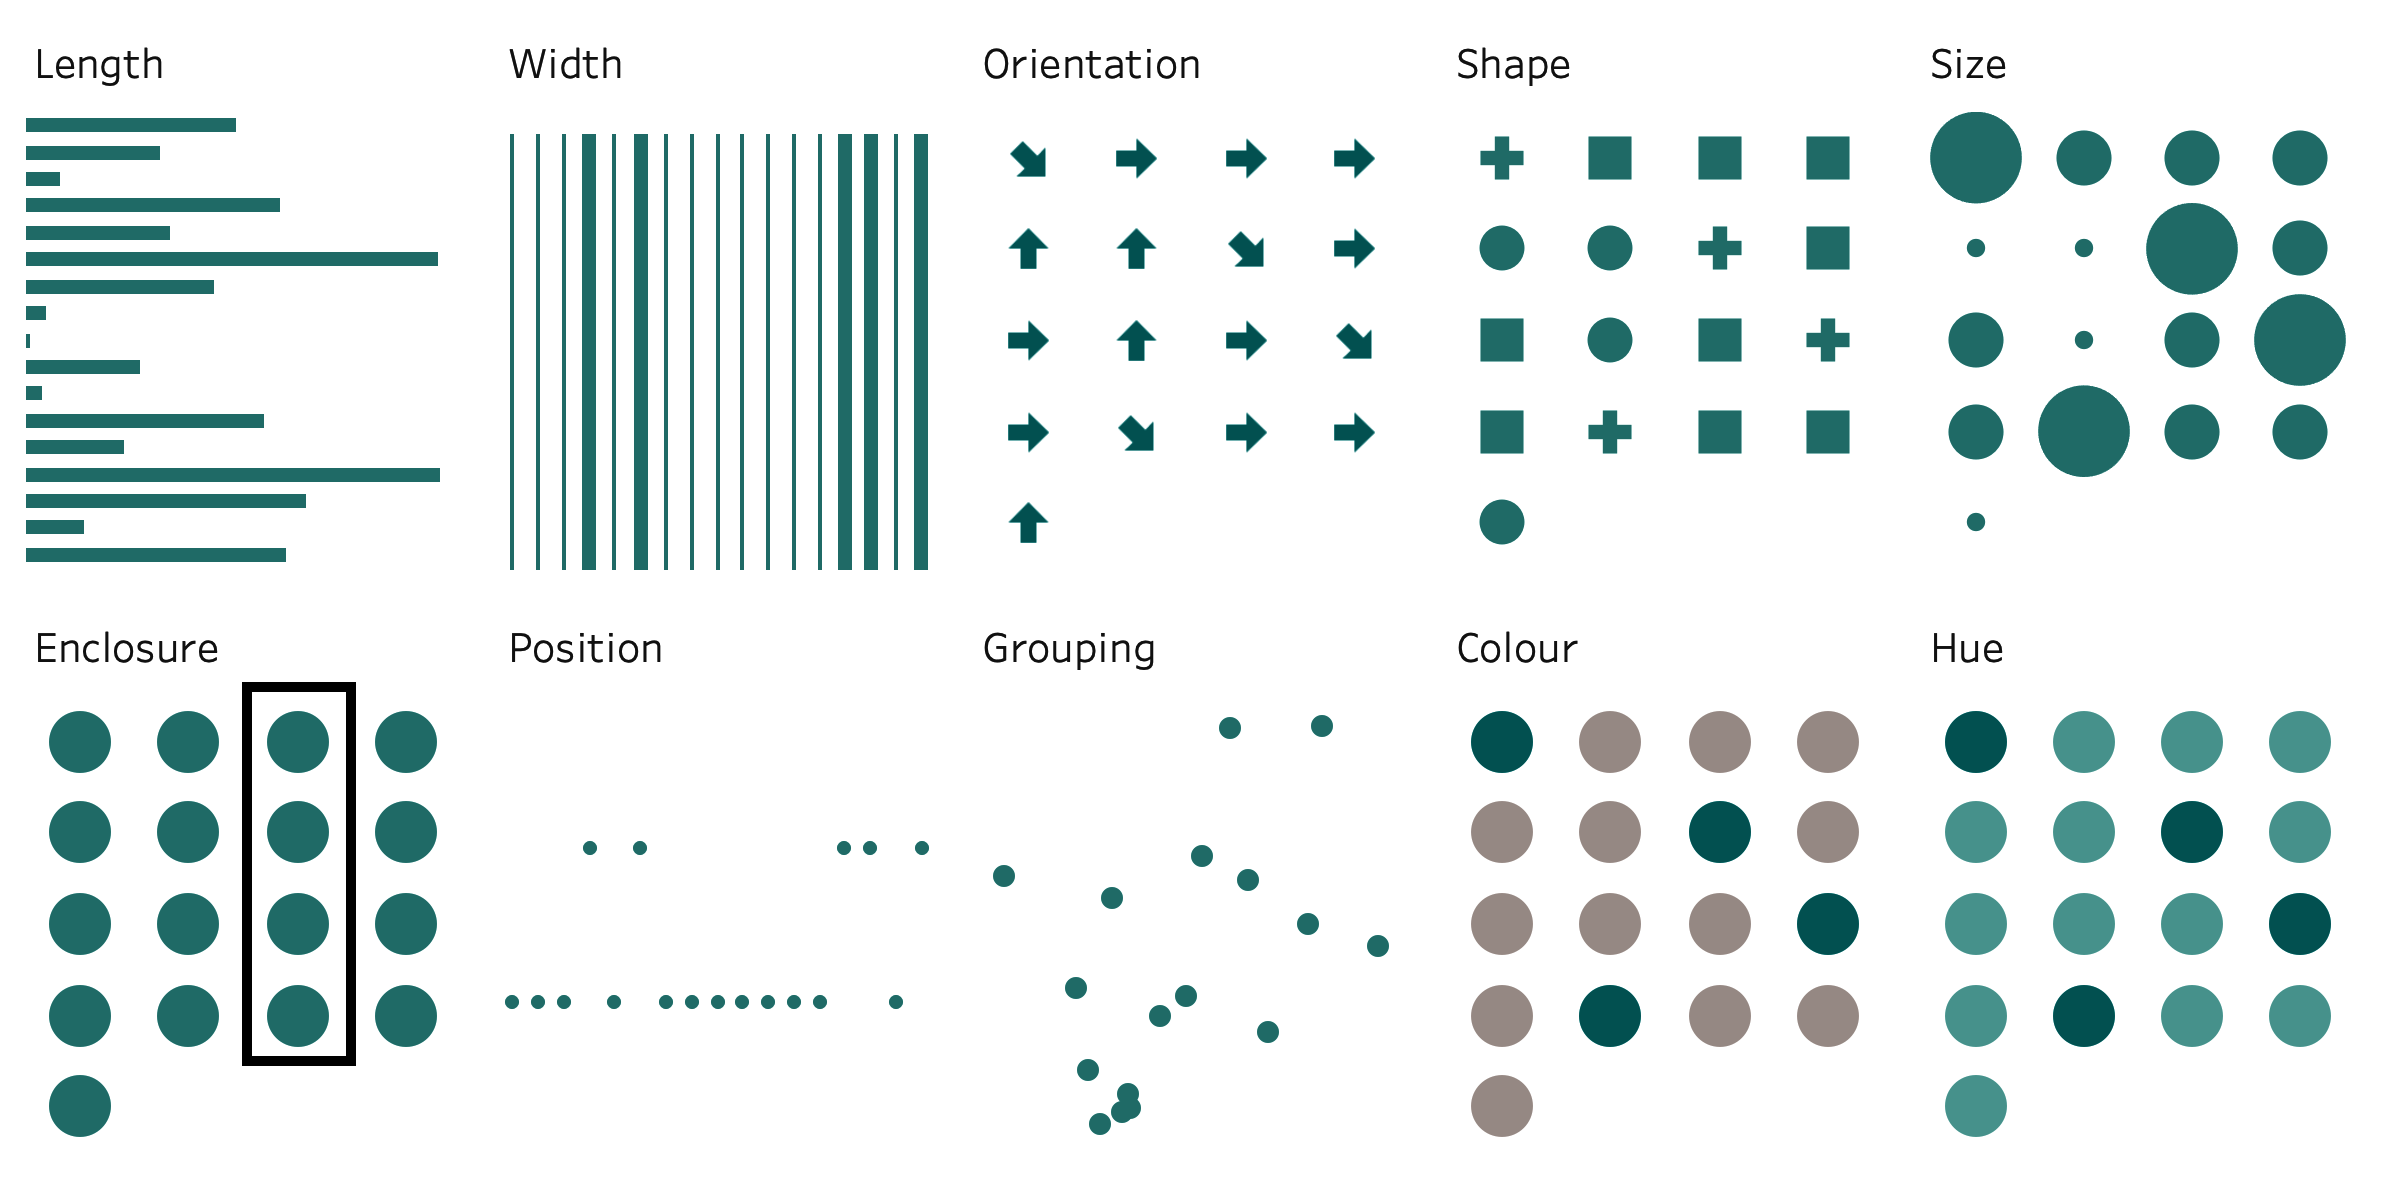
Each attribute is used because it allows our brains to process this information almost immediately, to quickly see patterns or trends easier. Some attributes are more effective than others; length, for example, is the easiest attribute to read. These attributes will be mentioned throughout this book.
Tableau Software offers several products. To start with, Tableau Prep Builder helps with data preparation. Tableau Online or Tableau Server allows you to share and collaborate with colleagues on data sources and dashboards. Finally, Tableau Desktop is a data visualization tool and the focus of this book.
I started teaching Tableau to myself more than six years ago now. As a student, I was used to learning through books. Throughout my journey, from student to a Tableau Zen Master, I have always thought it important to read blog posts and other books and to watch training videos.
A Tableau Zen Master is a selective program by Tableau; there are currently 43 in the world. To become a Zen Master, you need to show a deep understanding of how Tableau works, help teach other Tableau users, and collaborate with others.
During my journey, I was taught by the best of the best within The Information Labs Data School program, teaching the next generation of analysts. I have also enjoyed teaching other cohorts and the community. I help lead Workout Wednesday, a community initiative helping you build your Tableau skills, and I have published Tableau Tips on a regular basis. I love being able to share my knowledge with everyone. Writing this book has allowed me to share much of what I have learned and been taught over the last six years. I have condensed my knowledge into easy-to-follow recipes so you dont have to struggle, as I did, when first learning Tableau. I also add my own sprinkle of tips and tricks to make your Tableau better.
I recommend that less experienced or new users of Tableau read cover to cover, as I have structured the flow of chapters deliberately. If you are more experienced, you might be able to read chapters in isolation, especially for the newer features of Tableau, but you will learn more tips and tricks if you also read cover to cover.
This book has four parts. They have been ordered to go from basics to intermediate to advanced-level Tableau, which allows you to build on the skills throughout each chapter.
The first two chapters will take you through how to connect to various data sources, how you can relate them in different ways, and then how to get to grips with the Tableau workspace.
Once you have the knowledge of the data sets being used throughout this book and the workspace we will be using, will start giving you the understanding of the basic chart types in Tableau. By the end of the first seven chapters, you will know how to build your first dashboard.
Within these chapters, you will continue to learn about more advanced chart types and how you can format some elements within each of the charts. You will also learn how to use a story, which guides your users through a piece of analysis that you want to show them.
Font size:
Interval:
Bookmark:
Similar books «Tableau Desktop Cookbook»
Look at similar books to Tableau Desktop Cookbook. We have selected literature similar in name and meaning in the hope of providing readers with more options to find new, interesting, not yet read works.
Discussion, reviews of the book Tableau Desktop Cookbook and just readers' own opinions. Leave your comments, write what you think about the work, its meaning or the main characters. Specify what exactly you liked and what you didn't like, and why you think so.




![Jones - Communicating data with Tableau : [designing, developing, and delivering data visualizations; covers Tableau version 8.1]](/uploads/posts/book/108879/thumbs/jones-communicating-data-with-tableau.jpg)
