Contents
Introduction
Thank you for buying this e-book!
You have taken a step on the right path into becoming a Tableau expert. Whether if you have a low grasp on what Tableau is, or if you have already used the tool for a month or two, you will learn a lot of useful things here. I hope you have a great time going through each of the workouts as I had building them. Even I got to learn a few new features in Tableau on the way, so there really is something new to learn here for everyone, no matter your skill level.
Before starting
Download all material for the workouts here and save and extract the zip on your computer.
It is highly recommended to read this e-book using the Kindle for PC/Mac app, with Tableau opened on the side. You will be prompted to do actions such as copying text from here, so this way you will avoid typing it yourself.
As a reference, you will see ratings for each workout on the next criteria:
- Data : table size, if there is data conditioning, calculations, and the complexity of the data.
- Design : the quality, detail, coloring, and layout of the graphs and dashboard(s).
- Graphs : the type, the amount, and the level of configuration of the graphs.
- Interactivity : amount and complexity of filters, parameters, and actions.
Data
Design
Graphs
Interactivity
Tableau Desktop version 2019.4 is used throughout this e-book. I recommend you use this version as well by downloading it from here . If you dont have a license, you can activate the 14-day trial, which should be enough for you to cover all the workouts.
You will see that all workouts have Explained and Tip sections. These are not part of the workout, but rather additional information that will help you learn more. The first are to explain you an important theoretical concept while the second are best practices and personal comments on dashboard development.
And last but not least: if you face any difficulty during a workout, or if an instruction is not clear for you, you can contact me through the Facebook page for this e-book . I will personally help you in your problem, so you dont get stuck and are able to complete all nine of them.
You are now ready, on to the first workout!
Workout 1. Personal finance dashboard
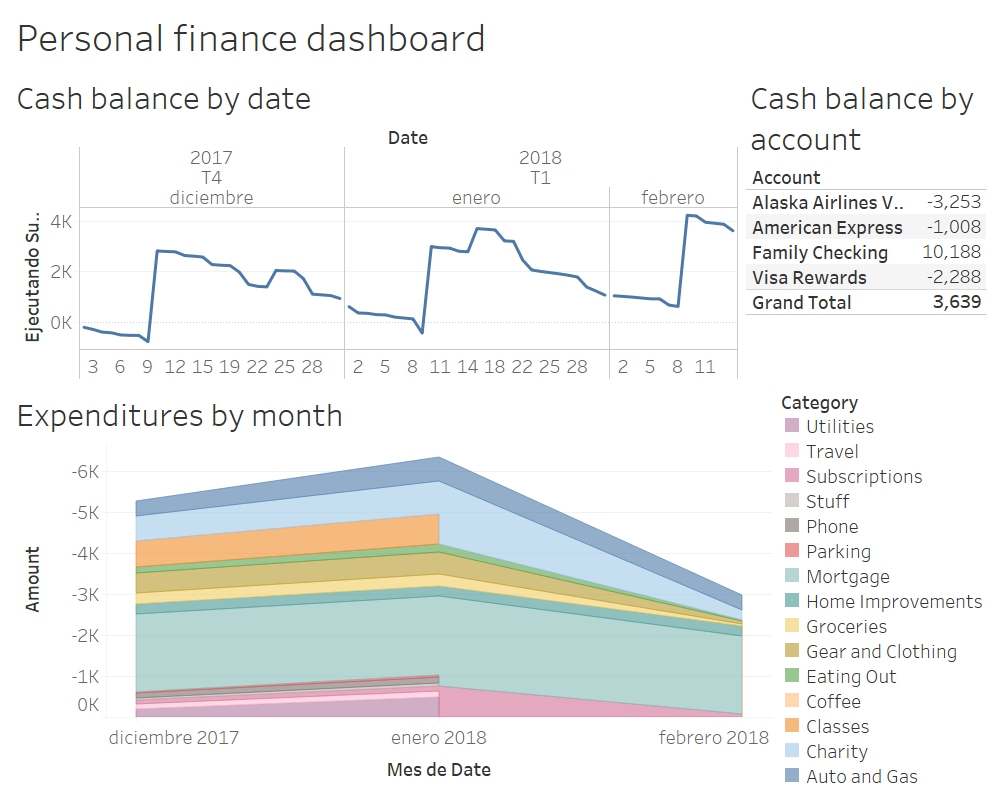
On this workout you will develop a basic but insightful dashboard for personal finance analysis:
Data
Design
Graphs
Interactivity
Workout Start
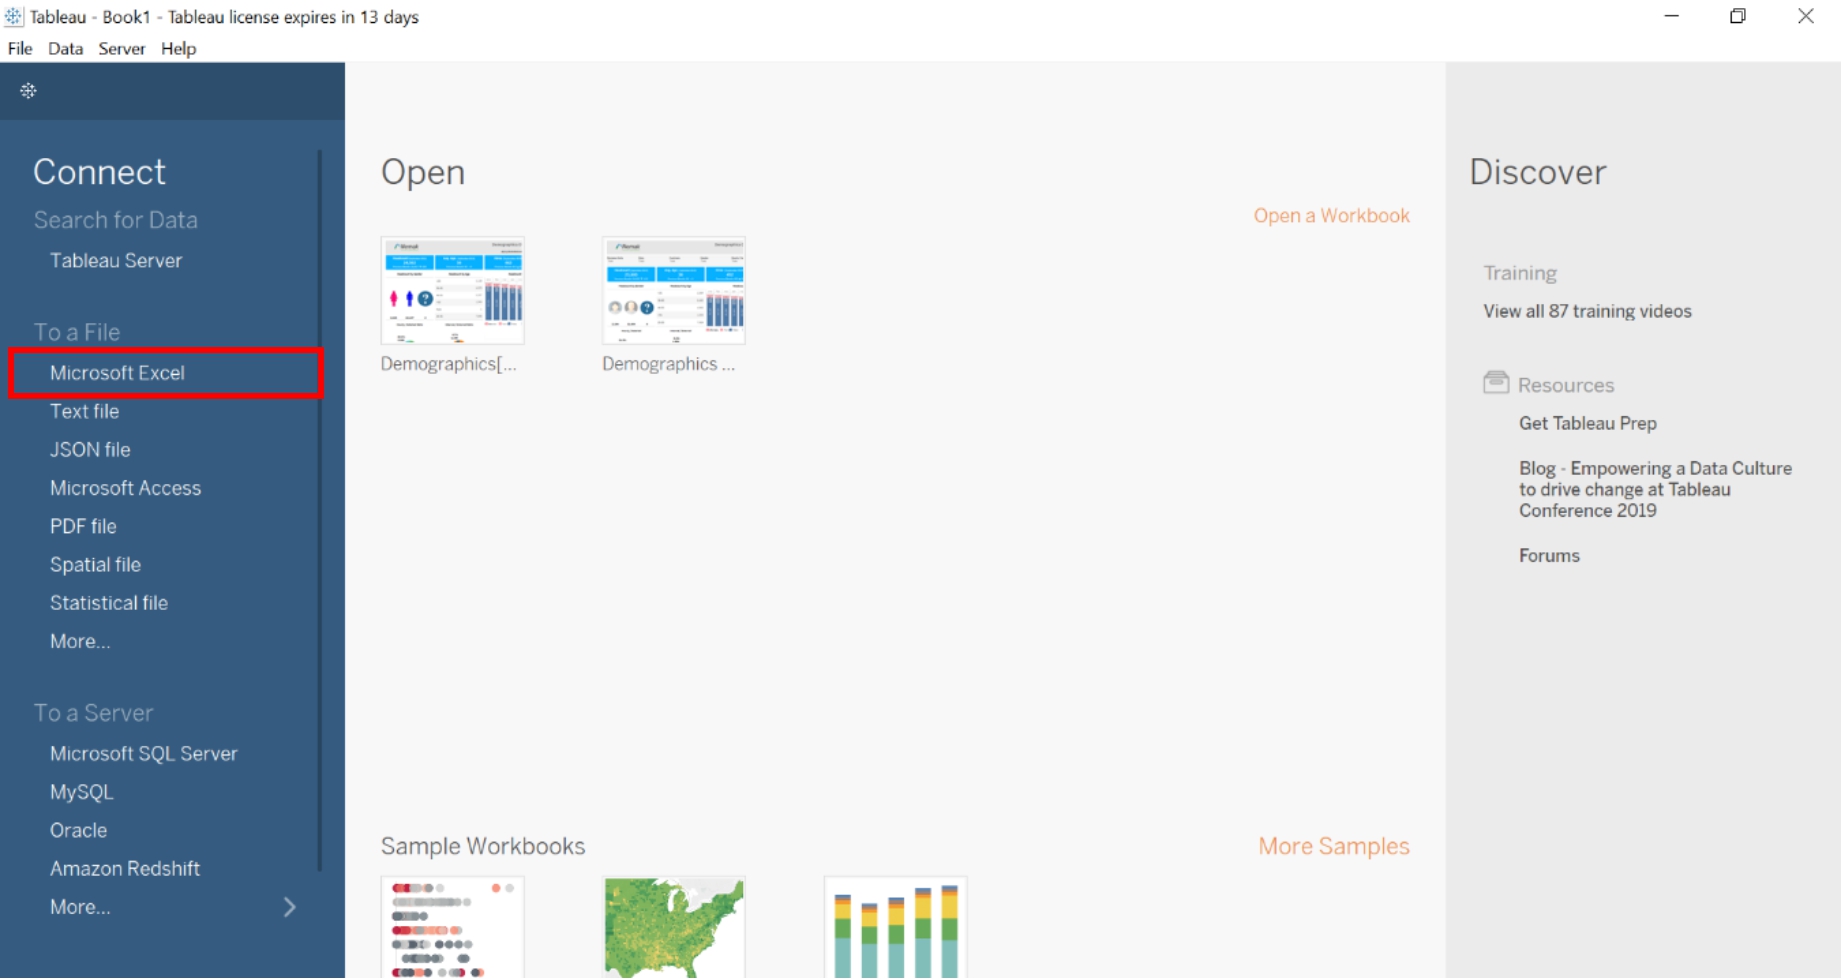
First step is creating a new workbook: open Tableau 2019.4, and on the left panel (called Connect ), click Microsoft Excel , as highlighted in the below image:
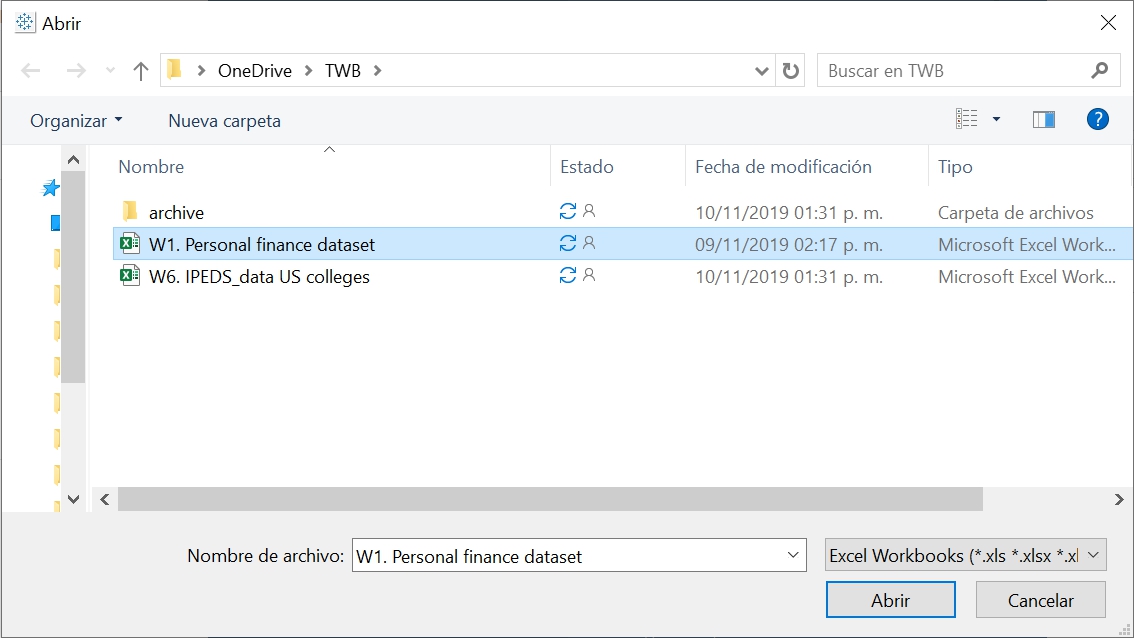
Select the W1 Personal finance dataset.xlsx file from the Materials folder you downloaded (refer to Before Starting ) and press OK.
Explained
When you open Tableau, you are presented with the startup page, divided in three sections:
1) Connect : use this pane to select a type of data source to connect to. With Tableau, you can connect to many types of sources, from Excel or comma-separated value (.csv) files, to SQL server or a Hadoop cluster. You can even use the contents of your clipboard as a data source, which means you could copy-paste a table from any place!
2) Open : here you will find the workbooks you have previously worked with, as well as sample workbooks that showcase Tableaus features through premade dashboards.
3) Discover : where you can find Tableau tips, tutorials, trainings, resources, and news.
Now that weve gone through the first step, lets go to the data preparation.
Explained:
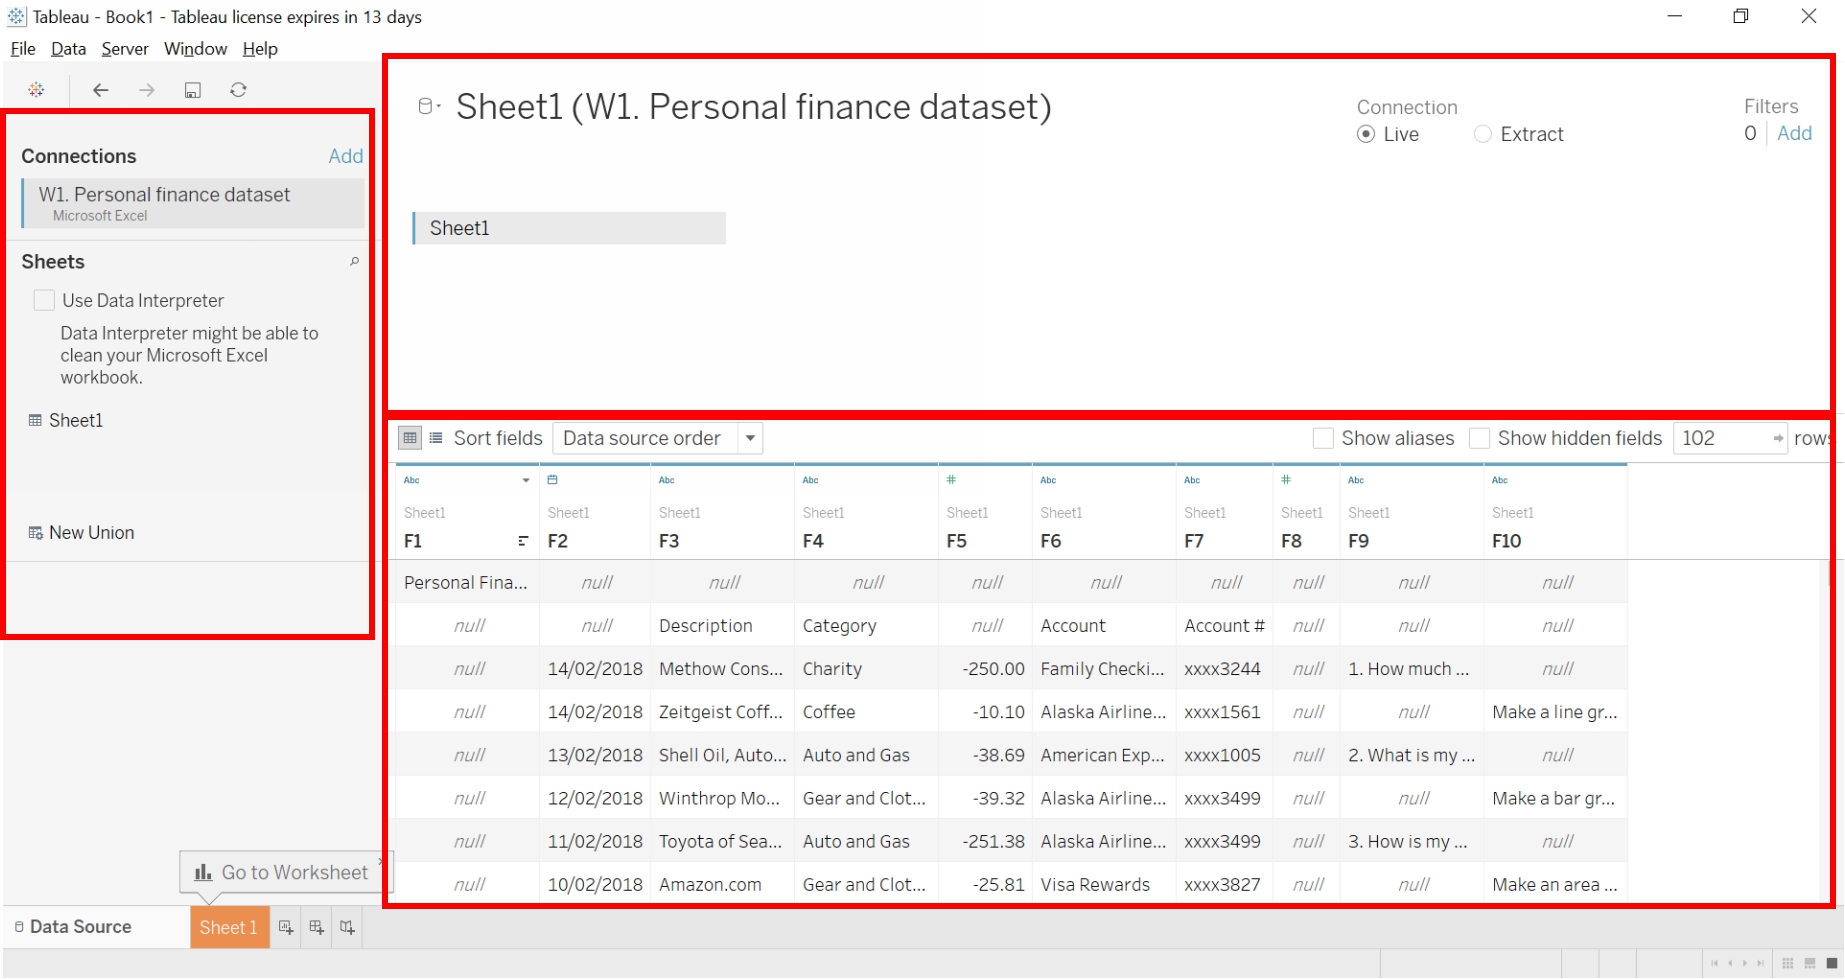
This is the Data Source tab, where you configure your data source(s). We will not go through all the features for now, but know that it is divided in three sections:
1) Connections (left): lets you see the source(s) you connected to. Clicking each connection, you will see below to it the different tables each contains. In this case, you see your Excel source, and below the only sheet it contains, Sheet1 .
2) Canvas (top center): shows the name of your data source in this case, Sheet1 (W1. Personal finance dataset) , the type of connection (live or extract), and the table(s) that you are connecting to. The canvas must have at least one table, and normally it will put it automatically, but if the canvas is empty, you must add a table.
3) Preview (bottom center): preloads a limited number of rows (as stated in the 102 rows dropdown), and lets you see how the table is being loaded. Here you can spot issues like Tableau not correctly assigning the column names and showing only F1, F2 dimensions, the inclusion of unnecessary columns, blank rows (populated by nulls), and other more advanced settings.
Tableau has already dragged our table Sheet1 to the canvas, but looking on the preview section, it seems it faced issues reading the table. If you open the original Excel file, you will see that the actual table starts from cell B3, there is a title on A1, and some comments on the right of the table.
We must make Tableau read the table correctly in order to use it. Now, you could fix this by modifying the Excel file; deleting the title and the comments, moving the table to start from A1, and so on. However, we will learn a different approach: by using Tableau Data Interpreter .
Click the checkbox on the Connections pane that says Use Data Interpreter , its right above Sheet1 . Doing so, Tableau will analyze Sheet1 and give you a better version of the table by removing blank rows, columns, titles, and more.
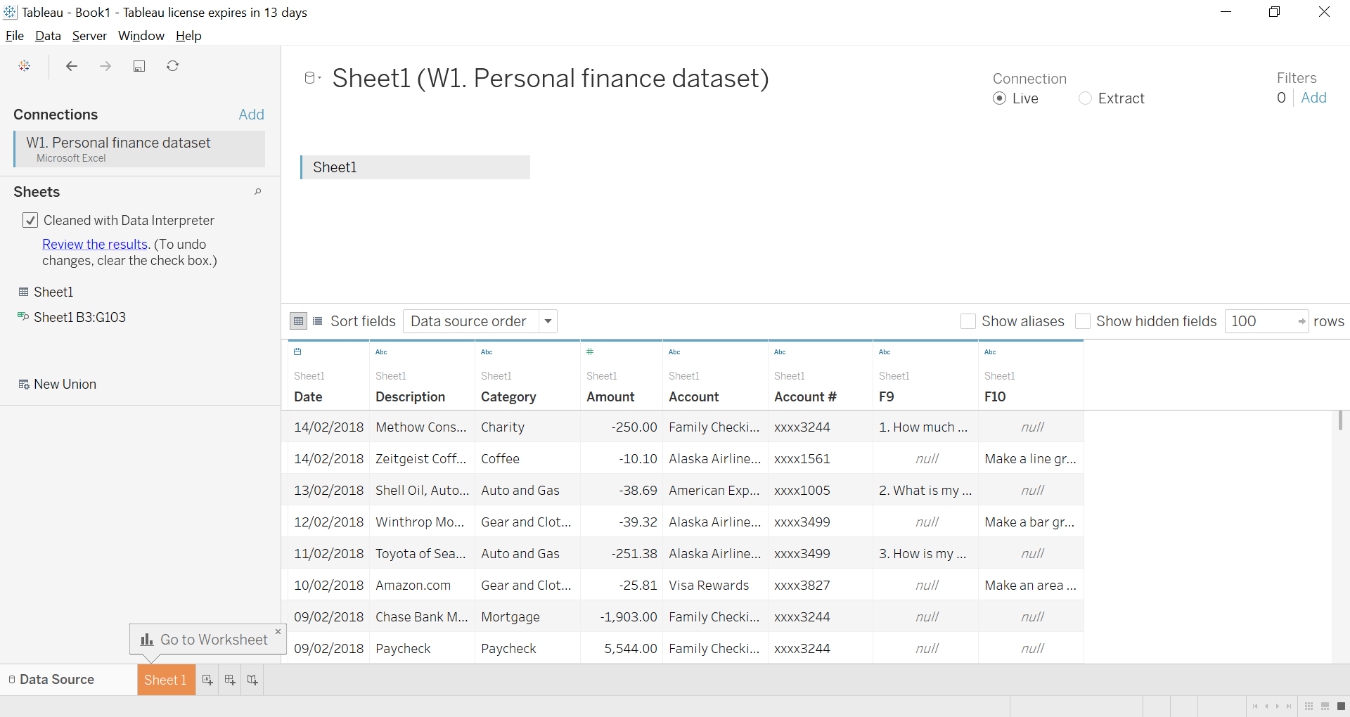
After its done, your table on the Preview area should look like this:
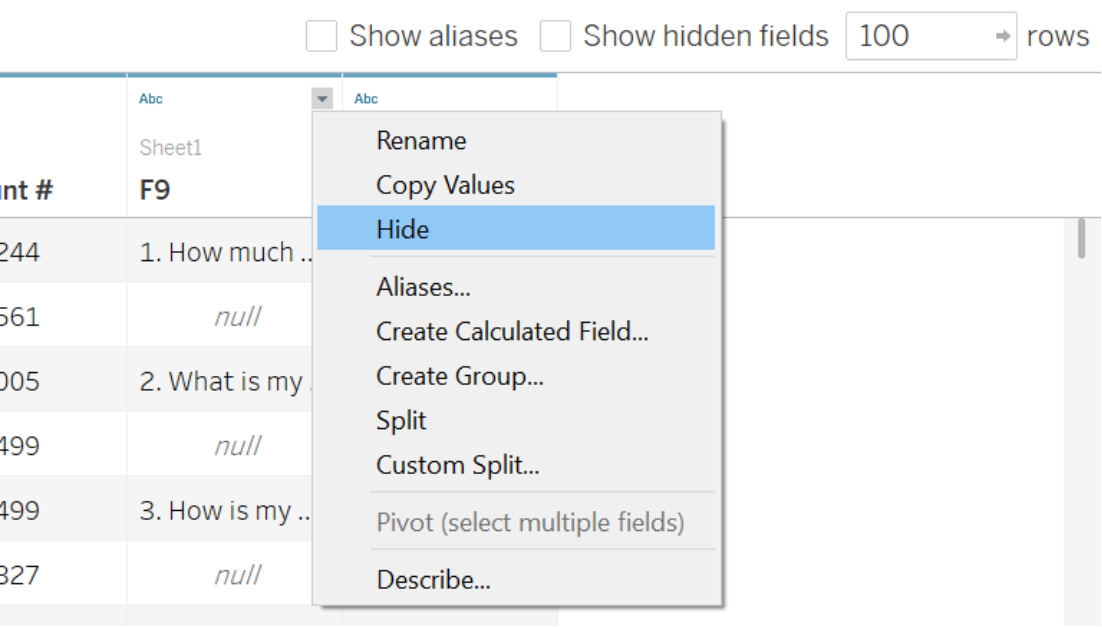
The column headers are now correct, there are no more nulls on the first line, and the first null column was removed. The Data Interpreter is not perfect, though. As a result, you see we still have the F9 and F10 columns, with the irrelevant comments that we saw before. For these, hover the mouse on the headers (F9 and F10), click the arrow on the top-right of each, and select Hide .
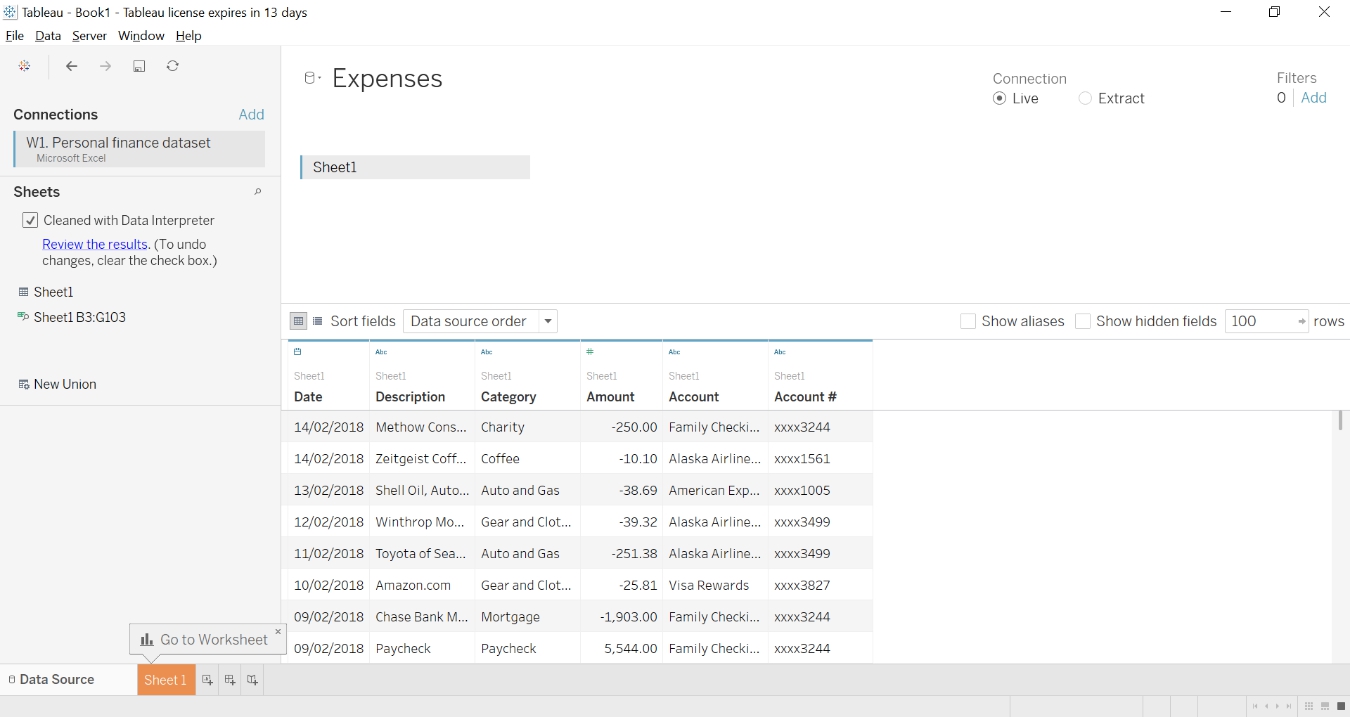
By doing so, your Data Source will not load F9 and F10. It is a good practice to always hide the columns that are not used, this will help in performance when you work with bigger tables.
Finally, to have clear labels, rename your data source to Expenses, by selecting the Sheet 1 (W1. Personal finance dataset) title at the top.
The data source is now ready to be used! Click on the orange Sheet 1 button at the bottom left, and lets start making our first graph.


