Peterson Kathleen - Tableau Public: The Ultimate Beginners Guide to Learn Tableau Public Step by Step
Here you can read online Peterson Kathleen - Tableau Public: The Ultimate Beginners Guide to Learn Tableau Public Step by Step full text of the book (entire story) in english for free. Download pdf and epub, get meaning, cover and reviews about this ebook. year: 2020, genre: Politics. Description of the work, (preface) as well as reviews are available. Best literature library LitArk.com created for fans of good reading and offers a wide selection of genres:
Romance novel
Science fiction
Adventure
Detective
Science
History
Home and family
Prose
Art
Politics
Computer
Non-fiction
Religion
Business
Children
Humor
Choose a favorite category and find really read worthwhile books. Enjoy immersion in the world of imagination, feel the emotions of the characters or learn something new for yourself, make an fascinating discovery.

- Book:Tableau Public: The Ultimate Beginners Guide to Learn Tableau Public Step by Step
- Author:
- Genre:
- Year:2020
- Rating:5 / 5
- Favourites:Add to favourites
- Your mark:
Tableau Public: The Ultimate Beginners Guide to Learn Tableau Public Step by Step: summary, description and annotation
We offer to read an annotation, description, summary or preface (depends on what the author of the book "Tableau Public: The Ultimate Beginners Guide to Learn Tableau Public Step by Step" wrote himself). If you haven't found the necessary information about the book — write in the comments, we will try to find it.
Peterson Kathleen: author's other books
Who wrote Tableau Public: The Ultimate Beginners Guide to Learn Tableau Public Step by Step? Find out the surname, the name of the author of the book and a list of all author's works by series.

![Jones - Communicating data with Tableau : [designing, developing, and delivering data visualizations; covers Tableau version 8.1]](/uploads/posts/book/108879/thumbs/jones-communicating-data-with-tableau.jpg)

Tableau Public: The Ultimate Beginners Guide to Learn Tableau Public Step by Step — read online for free the complete book (whole text) full work
Below is the text of the book, divided by pages. System saving the place of the last page read, allows you to conveniently read the book "Tableau Public: The Ultimate Beginners Guide to Learn Tableau Public Step by Step" online for free, without having to search again every time where you left off. Put a bookmark, and you can go to the page where you finished reading at any time.
Font size:
Interval:
Bookmark:
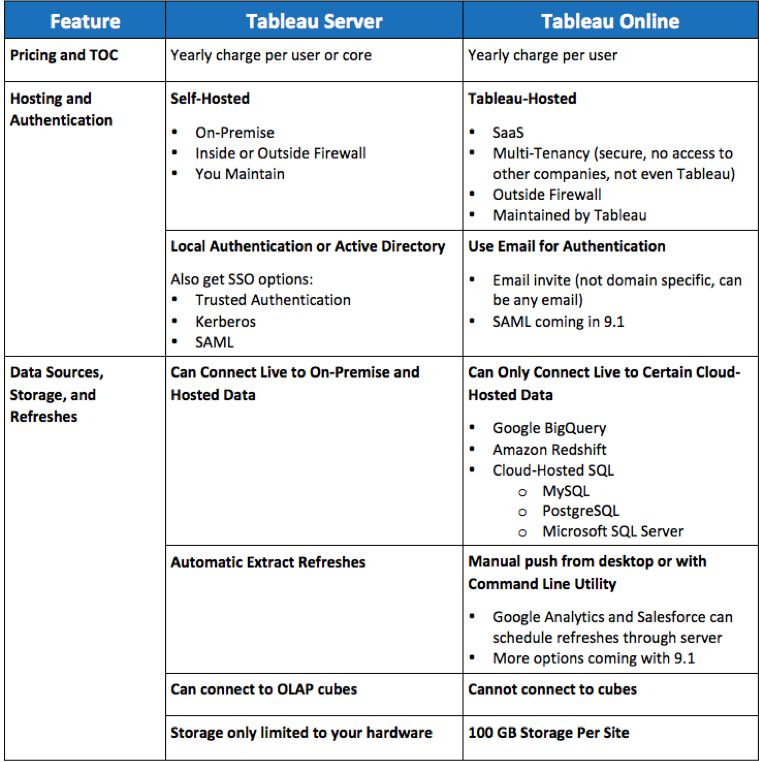
Tableau Public The Ultimate Beginner's Guide to Learn Tableau Public Step by Step By Kathleen Peterson nd Edition 2020 Memlnc.com Introduction Before Getting Started Tableau products The difference between Tableau Server and Tableau Online 12 Examples to represent data using Tablo 13 Chapter one Connect to data Connect to data The steps Workspace Data Visualization Show me 22 Change the way data is collected Automatically created fields Chapter II mathematical calculations Create a Calculated Field Quick Table Calculation Difference Percent difference Moving average Chapter III Marks Card Automatic mark Text Shape Bar Line How marks control the display 1. Colors 2.Change colors 3. Resize 4. Add Label 5. Add Tooltip Hints Chapter III Graph types Scatter Plot Box Plot Text table Motion Plot Heat Map Pie chart Donut Chart Histogram Bullet Graph Treemap tree map chart z-score Word cloud Waterfall Chart Area Chart Gantt Chart Chapter IV Dates Custom Date Fiscal Year Relative Date Filters Chapter V Group, Set and Filter Groups Set Create a dynamic set Merging the two groups Constant sets Filter Chapter six axis Adding axes to several metrics per width Dashboard Story
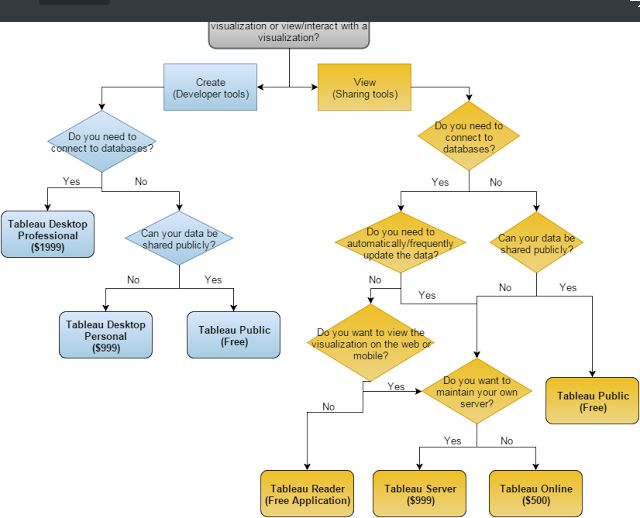
Ideal for web based publication, it ultimately allows users to merge multiple visualizations onto a single page and export their work as embeddable graphics. Unlike web-based visualization tools such as Google Fusion Tables or IBMs Many Eyes, Tableau is a desktop software with a unique interface and vernacular, factors that contribute to a slightly steeper learning curve; however, if you are looking for increased control over the visual features of your graphics, automated geographic coordinates and metrics or simply to familiarize yourself with a professional software on the rise, learning the ins and outs of Tableau is well worth the effort.
Some spreadsheets include titles or alternate column headers in their first few rows. Edit out any extraneous information to make your data legible for Tableaus software. Every subsequent row should describe one piece of data.
 2.
2. Pepole 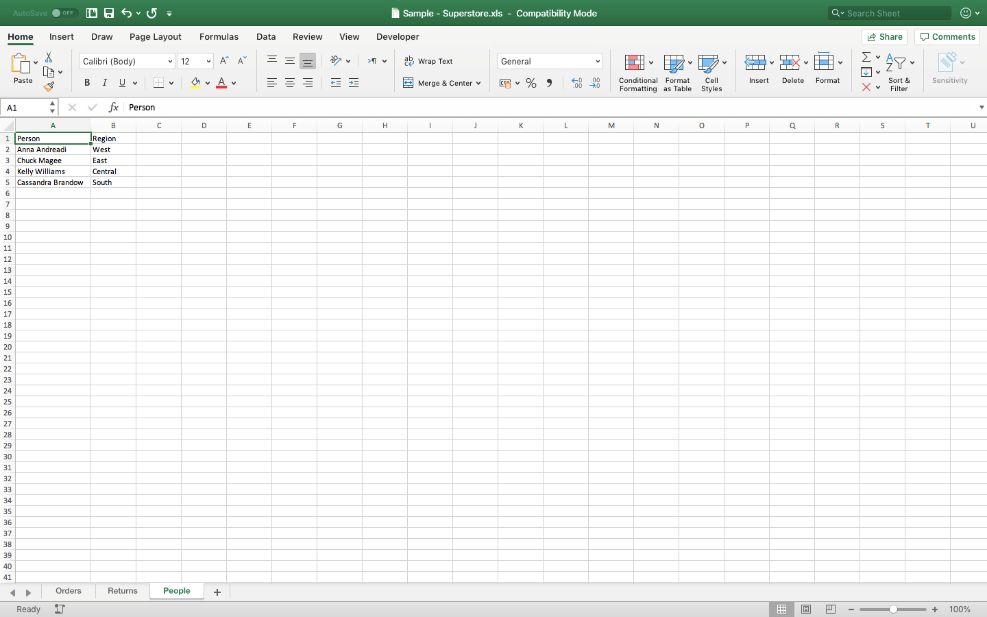 3. Returns
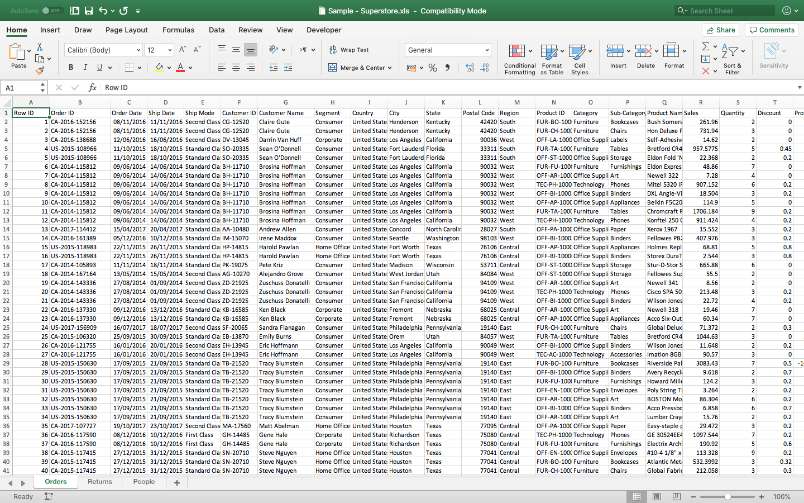
 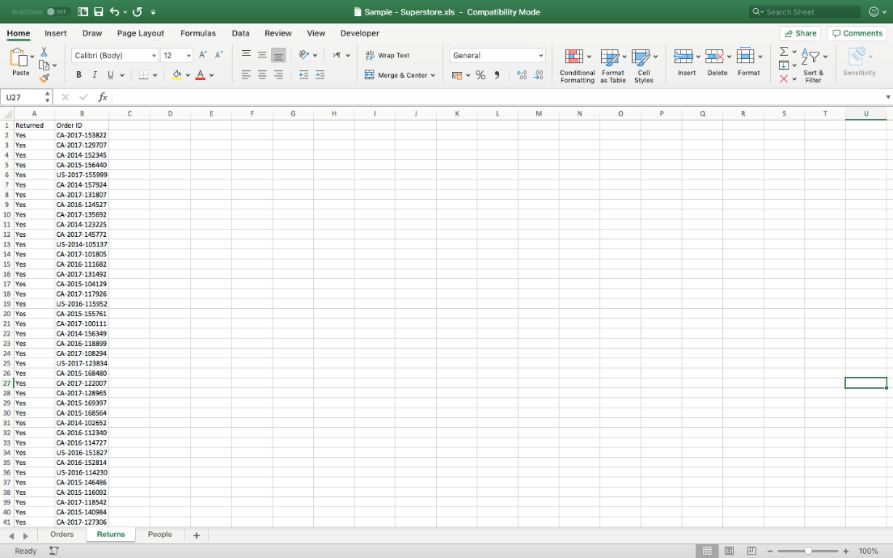 The steps : 1. From connect, select Microsoft excel, select the file, then the data source page appears for us
 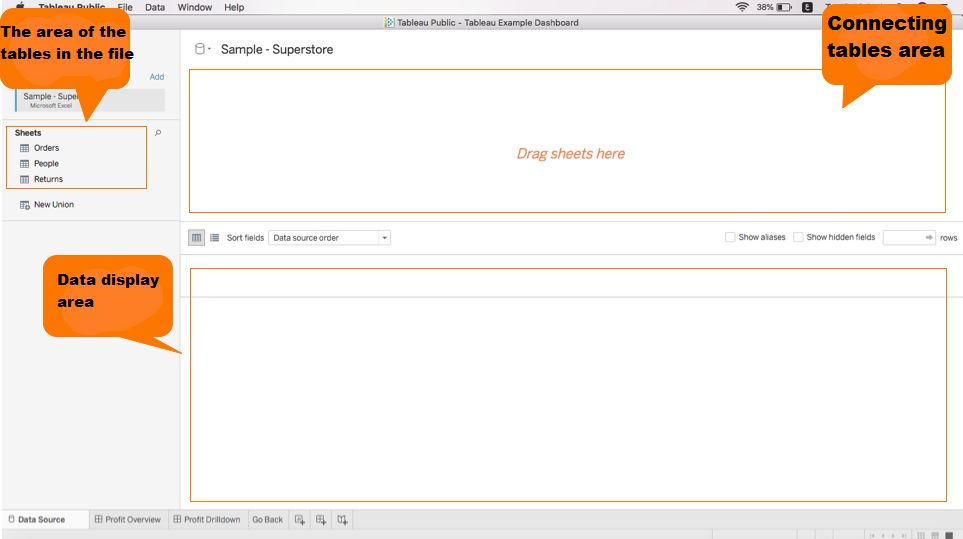 2. We drag the table from the left to the center, as in the image below:
 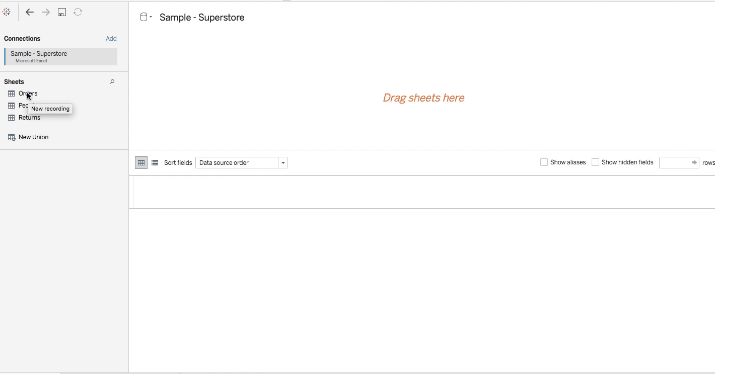 We will notice that an automatic link has been made between the Orders table and the People table and its type is Inner Join because there is a common column between them which is the Region Auto link is an internal link but we can change it as in the picture. If the shared column does not have the same name in the two tables, we will choose it manually.
 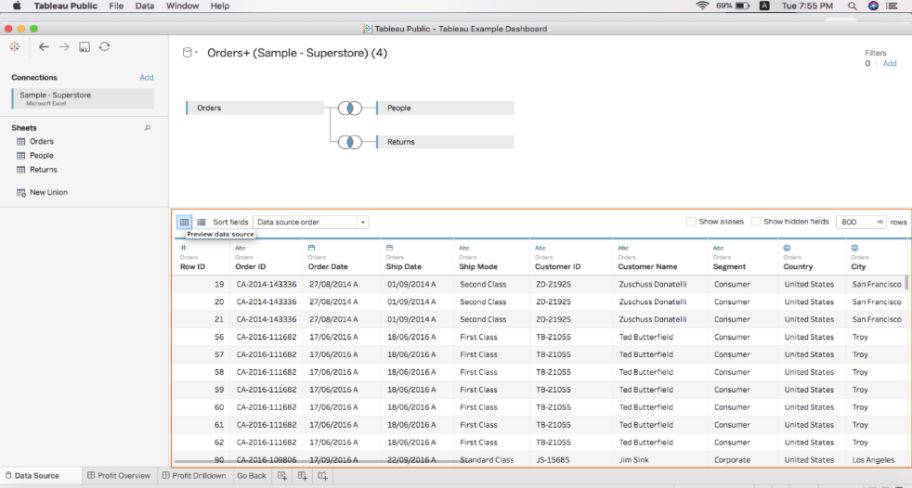 Types of data in the file: - Text values: order ID, Ship Mode, Customer ID, Customer Name, Segment, Region, Product ID, Category, Sub-Category, Product Name, Person, Returned. - Historical values in text formulas like: '1/7/2020', 'May 2023' which are here Order Date, Ship Date. - Historical values with time such as 20/3/2022 7:30:00 AM - Numeric Values: Row ID, Sales, Quantity, Discount, Profit - Geographic values such as cities and states: Country, City, State - Boolean: They are either true / false or 0/1 and an example here is Returned
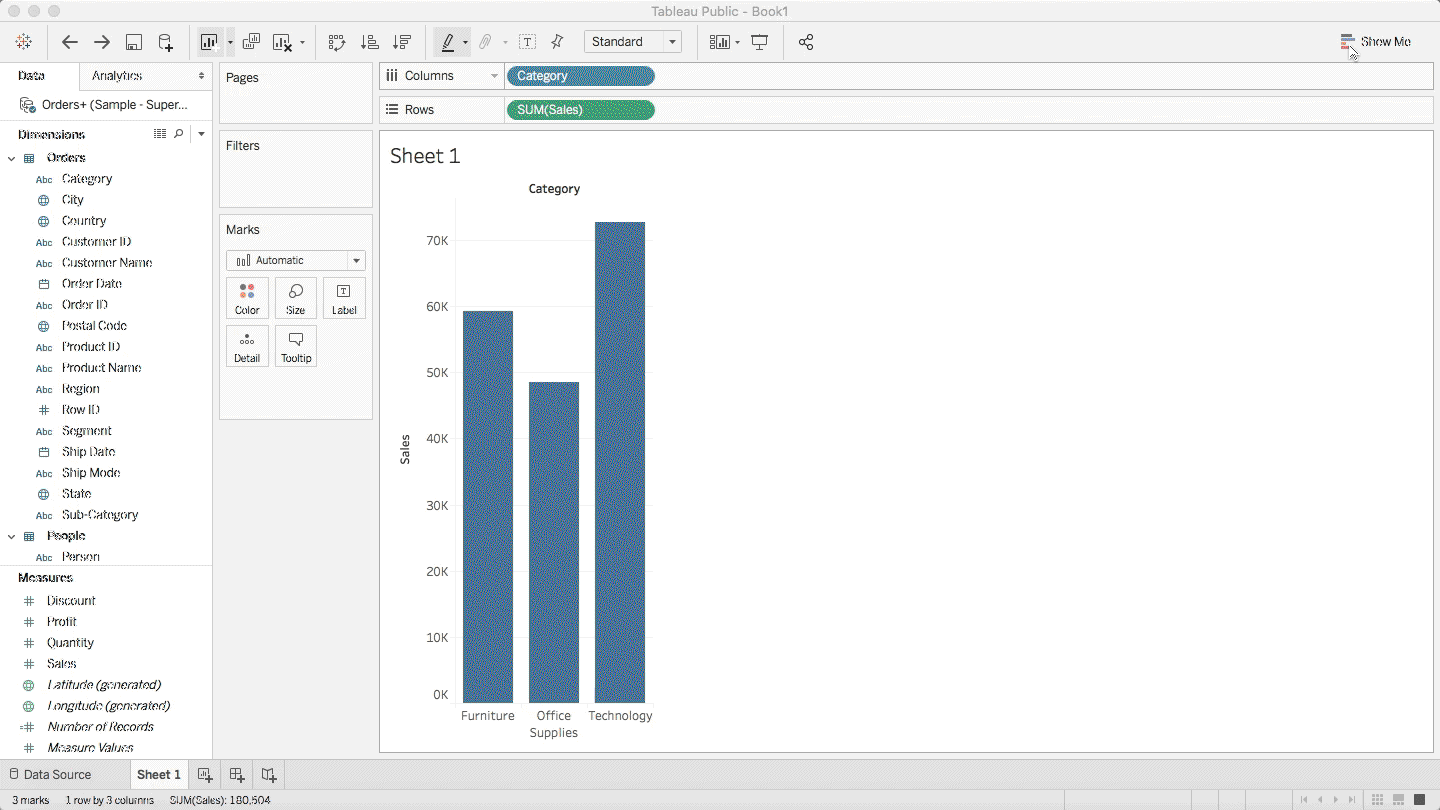
Related data: Data that takes values in a certain range of interstitial values such as Sales. We note that its values are 15.59, 21.8 Separate data: data that takes specific "integer" values such as Row ID. We note that its values are true 1,2,3 .. Data Visualization : 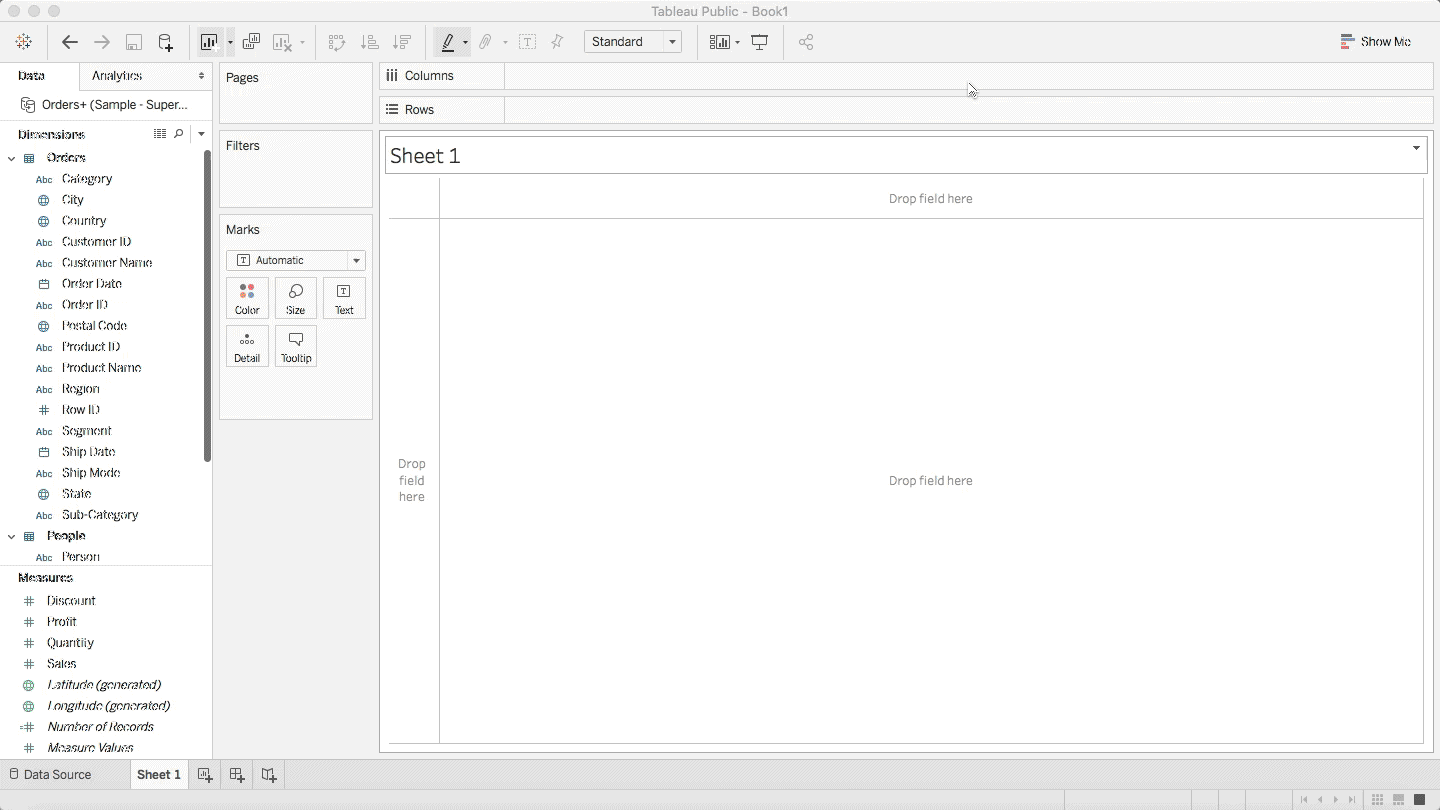 Change the names shown in the representation
 Next page
Font size:
Interval:
Bookmark:
Similar books «Tableau Public: The Ultimate Beginners Guide to Learn Tableau Public Step by Step»
Look at similar books to Tableau Public: The Ultimate Beginners Guide to Learn Tableau Public Step by Step. We have selected literature similar in name and meaning in the hope of providing readers with more options to find new, interesting, not yet read works.
Discussion, reviews of the book Tableau Public: The Ultimate Beginners Guide to Learn Tableau Public Step by Step and just readers' own opinions. Leave your comments, write what you think about the work, its meaning or the main characters. Specify what exactly you liked and what you didn't like, and why you think so.