• Complain

NARAYANAN - Data Visulization with Tableau for Beginners

Here you can read online NARAYANAN - Data Visulization with Tableau for Beginners full text of the book (entire story) in english for free. Download pdf and epub, get meaning, cover and reviews about this ebook. year: 2021, publisher: N Selvam, genre: Computer / Science. Description of the work, (preface) as well as reviews are available. Best literature library LitArk.com created for fans of good reading and offers a wide selection of genres:

Romance novel Science fiction Adventure Detective Science History Home and family Prose Art Politics Computer Non-fiction Religion Business Children Humor

Choose a favorite category and find really read worthwhile books. Enjoy immersion in the world of imagination, feel the emotions of the characters or learn something new for yourself, make an fascinating discovery.

No cover
  • Book:
    Data Visulization with Tableau for Beginners
  • Author:
  • Publisher:
    N Selvam
  • Genre:
  • Year:
    2021
  • Rating:
    3 / 5
  • Favourites:
    Add to favourites
  • Your mark:
    • 60
    • 1
    • 2
    • 3
    • 4
    • 5

Data Visulization with Tableau for Beginners: summary, description and annotation

We offer to read an annotation, description, summary or preface (depends on what the author of the book "Data Visulization with Tableau for Beginners" wrote himself). If you haven't found the necessary information about the book — write in the comments, we will try to find it.

This book is a step by step guide on how to use Tableau to do the visualization / analysisIt is ideal for anyone who is new to TableauThere are 14 Chapters and over 60 hands-on exerciseLinks to download the datasets for the exercises are includedThere is a chapter on analyzing lottery results and another chapter on building various charts for the stock market

NARAYANAN: author's other books


Who wrote Data Visulization with Tableau for Beginners? Find out the surname, the name of the author of the book and a list of all author's works by series.

Data Visulization with Tableau for Beginners — read online for free the complete book (whole text) full work

Below is the text of the book, divided by pages. System saving the place of the last page read, allows you to conveniently read the book "Data Visulization with Tableau for Beginners" online for free, without having to search again every time where you left off. Put a bookmark, and you can go to the page where you finished reading at any time.

Light

Font size:

Reset

Interval:

Bookmark:

Make
Copyright Copyright 2020 by N Selvam CAM ACMA CGMA Published by N - photo 1
Copyright
Copyright 2020 by N. Selvam CA(M), ACMA, CGMA
Published by:
N Selvam
1108, Lobby 2,
11th Floor, Block A, Damansara Intan,
No. 1, Jalan SS20/27, 47400 Petaling Jaya,
Selangor Darul Ehsan,
Malaysia
December 2020
All rights reserved. Reproduction or use, without express permission of editorial or pictorial contents, in any manner is prohibited. No patent liability is assumed with respect to the use of the information contained herein. While every precaution has been taken in the preparation of this manual, the publisher assumes no responsibility for errors or omissions. Neither is any liability assumed for damages resulting from the use of the information contained herein.
ISBN Number: 978-967-18073-1-6
Tableau Public and Desktop
- Is a registered trademark of Tableau Software, LLC.
Microsoft Excel
- Is a registered trademark of Microsoft Corporation
Preface to the Second Edition
I wish to express my sincere gratitude to all who purchased my 1 st Edition of Data Visualization with Tableau for Beginners. Thank you. You have given me the strength and inspiration to release the 2 nd Edition.
When preparing this 2 nd edition, my primary focus was to make it easier for anyone who was new to Tableau to complete all the exercises in my book. Many slips and shortcomings in the previous edition have been set right.
I made significant changes to this Edition as many students and the working public made constant references to my book when learning how to use Tableau. The Chapters have been re-organized and increased from 8 to 14. I also included 2 Chapters on topics that would appeal to many. Charting Lottery Results and Stock Market.
The learning must never stop.
I am glad I was able to help many of my readers to broaden their knowledge and acquire skills sets on data visualization through my book.
My greatest satisfaction is when I get a mail telling me how much my book has helped them in their career path.
N Selvam
Dedication
This book is dedicated to my late mother, D.Mageswary. She passed away on 22 Nov 2020 and my 2 children: Eily Lee Selvam and Nelly Lee Selvam.
Acknowledgments
My first Edition was released in June 2020 and I wanted the 2 nd Edition to be ready in December 2020.
Getting the 2 nd Edition out was a real challenge. I did many hands-on training sessions on Tableau and gathered extensive feedback on what topics my readers would like to see in my next book. Many of them suggested I should include a Topic on Lottery and one more Topic on Share Market and I am glad I managed to do this in my 2 nd Edition.
My wife Eluza and my two children were always there to give me all the support I needed and I will always be grateful. Writing took up a lot of my personal time.
I would like to place on record my sincere thanks to Aaron K Abraham. He went that extra mile to help me with the promotion for my 1 st Edition. I called him my social media guru. I would also to thank my Team Members from N Selvam Consult (S.Magesvary who helped to liaise with the printers and Kenneth Goh who did the proofreading and assisted extensively with the contents and pictures). Big help to ensure the book was released on time.
Table of Contents
Chapter 1
Introduction
Chapter 1 - Introduction
What is Tableau?
Tableau is a powerful and fast-growing data visualization tool used in the Business Intelligence Industry. It helps in simplifying raw data into easily understandable format.
Why do we use Tableau for data visualization?
Tableau is easy to learn and use. Tableau helps anyone quickly analyze, visualize and share information. Data analysis is fast with Tableau and the visualizations created are in the form of worksheets, dashboards and stories.
6 steps in the data visualization process
1. What do you want to analyse?
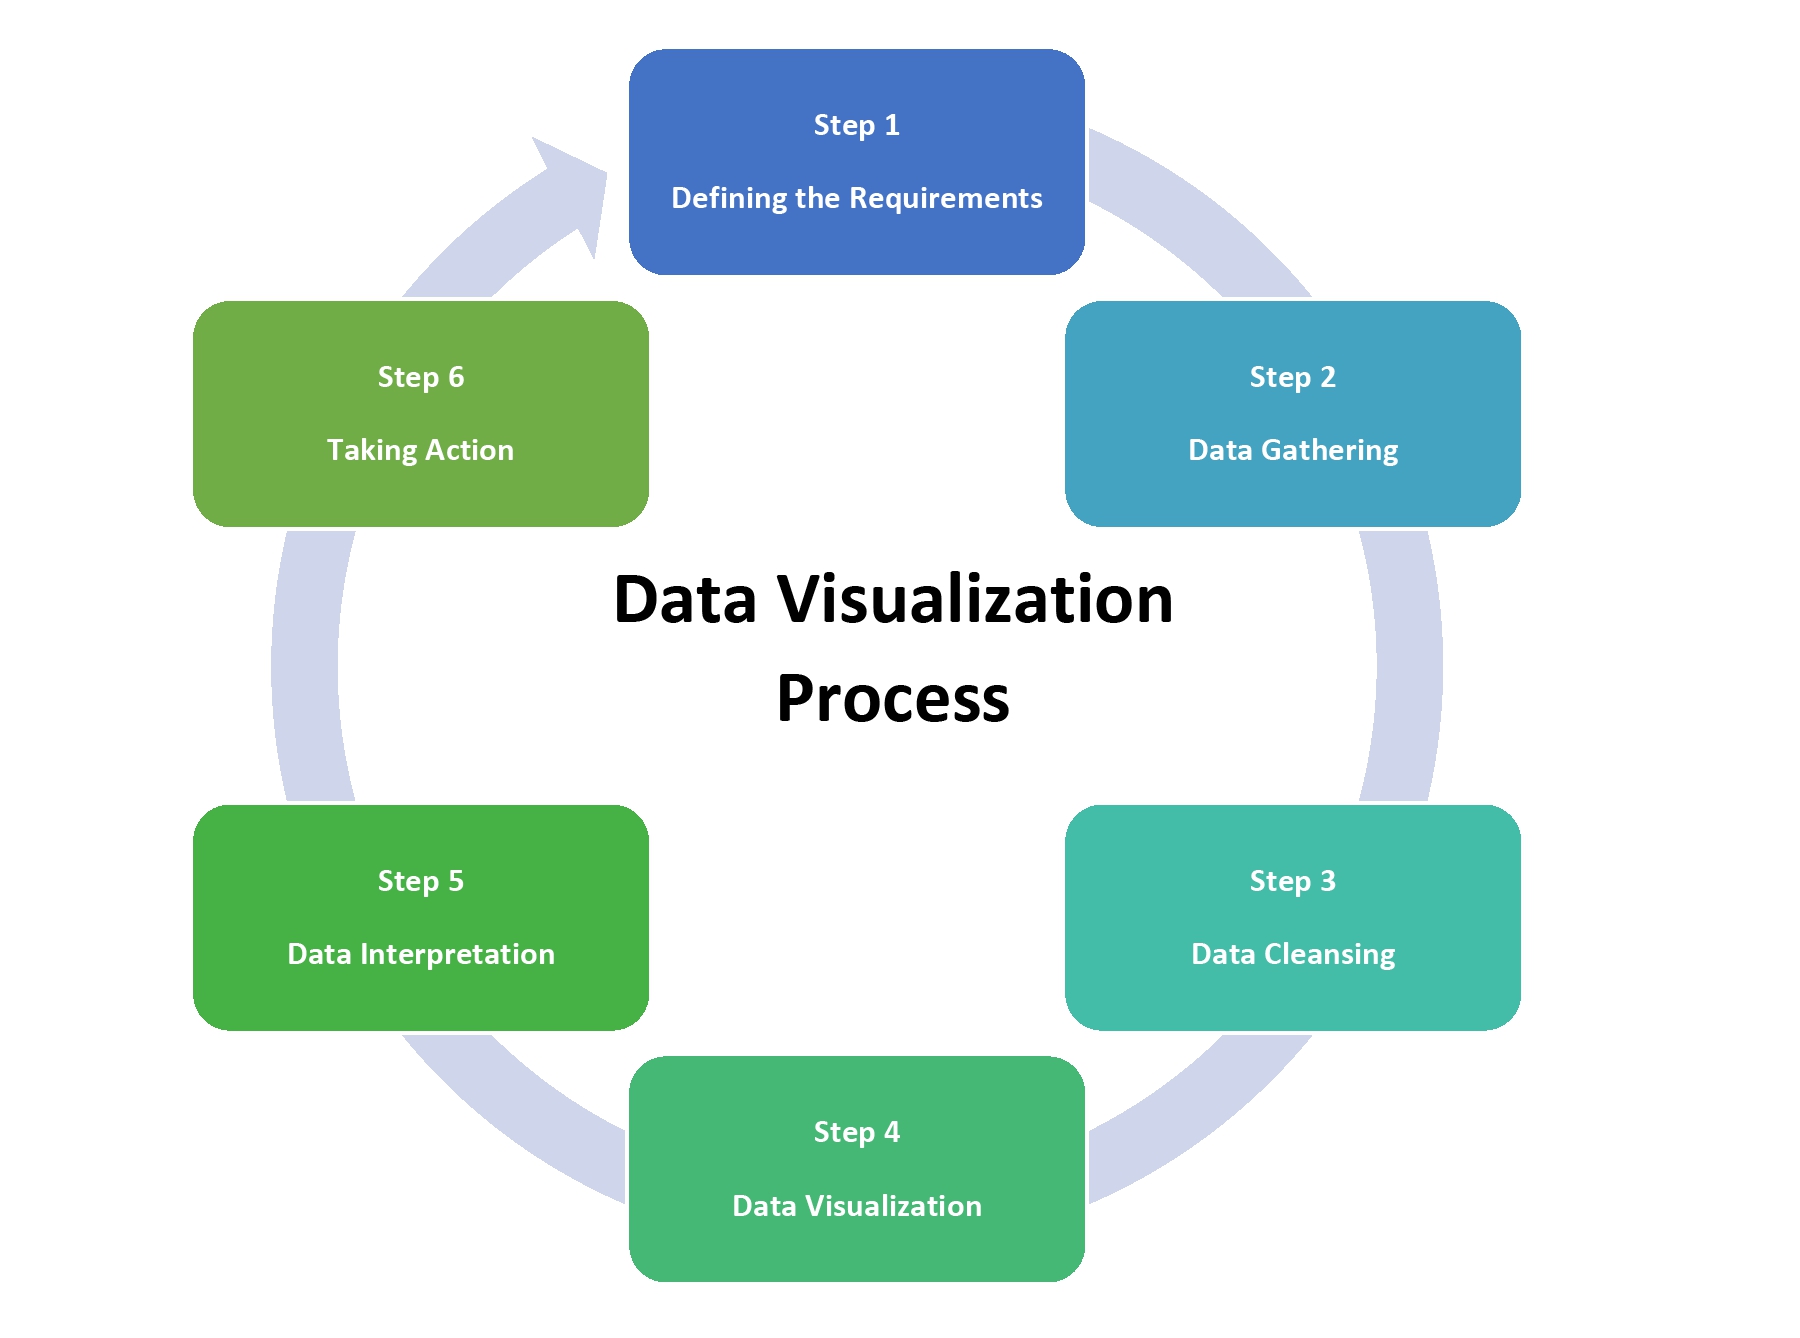
You must clearly define what you are trying to analyse. E.g. why was there a drop in sales revenue over the last 12 months?
2. Gather the data relevant to this analysis.
After a purpose has been defined, commence collection of data that is relevant to this analysis. This step is important because whichever sources of data are chosen will determine how in-depth the analysis is.
3. Does the data require cleansing?
Before starting any analysis, one of the key issues to consider is whether the data is in the right format. Can the data be used as is or requires data cleansing? Data cleansing is extremely important during the data analysis process because you could have received bad data.
4. Use the right tools for the visualization.
Data visualization is used primarily to present results. Tableau would be an excellent tool to get this job done.
5. Interpret the results.
The next step is interpreting the results from the data visualization. This step is important because it is how a business will gain actual value from using the right software. The interpretation however, is relative. It will depend on your domain knowledge, skills and experiences.
6. Take action.
What action is taken and how soon will depend on many factors e.g. finances, urgency, policy and man power.
What is happening in todays world There is huge amount of data available from - photo 2
What is happening in todays world?
There is huge amount of data available from so many different sources because of technological advancement. People all over the world are accessing the same data sets for multiple reasons and have different interpretations. The important task is working towards getting the analysis right and communicating the findings with the relevant parties. We know for a fact that people tend to understand complex information when pictures and stories are used. We are aware to communicate effectively, we must use a combination of images and words that explains the underlying data and analysis.
This is where Tableau comes in. It is truly amazing what the draganddrop features in Tableau can do. It lets you explore the data in so many ways and to share the results with anyone on your list.
Tableau Products
A cross-section of the Tableau Products.
1. Tableau Reader
httpswwwtableaucomproductsreader Tableau Reader is a free desktop - photo 3
https://www.tableau.com/products/reader
Tableau Reader is a free desktop application that allows you to open and interact with Tableau workbook files that have been created in Tableau Public and Desktop. However, it is not possible to make any changes to the visualizations using Tableau Reader.
2. Tableau Public
httpspublictableaucomen-ussdownload Tableau Public is a free software - photo 4
https://public.tableau.com/en-us/s/download
Tableau Public is a free software that allows you to connect to a spreadsheet or file and create interactive data visualizations for the web. Tableau Public is a hosting service for the publication of data visualizations to the web. It is used by newsrooms and bloggers, companies, research institutes, governmental bodies and nongovernmental organizations that aim to get their stories into the public eye. Good starting point to build a career in data visualization.
Next page
Light

Font size:

Reset

Interval:

Bookmark:

Make

Similar books «Data Visulization with Tableau for Beginners»

Look at similar books to Data Visulization with Tableau for Beginners. We have selected literature similar in name and meaning in the hope of providing readers with more options to find new, interesting, not yet read works.


Reviews about «Data Visulization with Tableau for Beginners»

Discussion, reviews of the book Data Visulization with Tableau for Beginners and just readers' own opinions. Leave your comments, write what you think about the work, its meaning or the main characters. Specify what exactly you liked and what you didn't like, and why you think so.