• Complain

Charles D. Hansen Min Chen Christopher R. Johnson Arie - Scientific visualization: uncertainty, multifield, biomedical, and scalable visualization

Here you can read online Charles D. Hansen Min Chen Christopher R. Johnson Arie - Scientific visualization: uncertainty, multifield, biomedical, and scalable visualization full text of the book (entire story) in english for free. Download pdf and epub, get meaning, cover and reviews about this ebook. City: London, year: 2014, publisher: Springer London, genre: Computer. Description of the work, (preface) as well as reviews are available. Best literature library LitArk.com created for fans of good reading and offers a wide selection of genres:

Romance novel Science fiction Adventure Detective Science History Home and family Prose Art Politics Computer Non-fiction Religion Business Children Humor

Choose a favorite category and find really read worthwhile books. Enjoy immersion in the world of imagination, feel the emotions of the characters or learn something new for yourself, make an fascinating discovery.

Charles D. Hansen Min Chen Christopher R. Johnson Arie Scientific visualization: uncertainty, multifield, biomedical, and scalable visualization

Scientific visualization: uncertainty, multifield, biomedical, and scalable visualization: summary, description and annotation

We offer to read an annotation, description, summary or preface (depends on what the author of the book "Scientific visualization: uncertainty, multifield, biomedical, and scalable visualization" wrote himself). If you haven't found the necessary information about the book — write in the comments, we will try to find it.

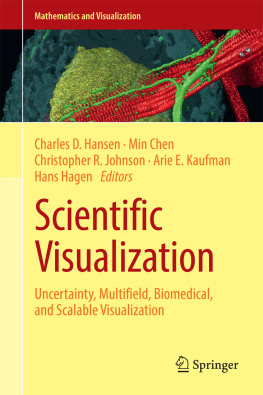
Overview and State-of-the-Art of Uncertainty Visualization -- Uncertainty Visualization and Color Vision Deficiency -- Analysis of Uncertain Scalar Data with Hixels -- On the (Un)Suitability of Strict Feature Definitions for Uncertain Data -- The Haunted Swamps of Heuristics: Uncertainty in Problem Solving -- Visualizing Uncertainty in Predictive Models -- Incorporating Uncertainty in Intrusion Detection to Enhance Decision Making -- Fuzzy Fibers: Uncertainty in dMRI Tractography -- Mathematical Foundations of Uncertain Field Visualization -- Definition of a Multifield -- Categorization -- Fusion of Visual Channels -- Glyph-Based Multifield Visualization -- Derived Fields -- Interactive Visual Exploration and Analysis -- Visual Exploration of Multivariate Volume Data Based on Clustering -- Feature-Based Visualization of Multifields -- Feature Analysis in Multifields -- Future Challenges and Unsolved Problems in Multi-Field Visualization -- Overview of Visualization in Biology and Medicine -- Visualization in Connectomics -- Visualization in Biology and Medicine -- From Individual to Population: Challenges in Medical Visualization -- The Ultrasound Visualization Pipeline -- Visual Exploration of Simulated and Measured Blood Flow -- Large-Scale Integration-Based Vector Field Visualization -- Large Scale Data Analysis -- Cross-Scale, Multi-Scale, and Multi-Source Data Visualization and Analysis Issues and Opportunities -- Scalable Devices -- Scalable Representation -- Distributed Post-Processing and Rendering for Large-Scale Scientific Simulations.;Based on the seminar that took place in Dagstuhl, Germany in June 2011, this contributed volume studies the four important topics within the scientific visualization field: uncertainty visualization, multifield visualization, biomedical visualization and scalable visualization.? Uncertainty visualization deals with uncertain data from simulations or sampled data, uncertainty due to the mathematical processes operating on the data, and uncertainty in the visual representation,? Multifield visualization addresses the need to depict multiple data at individual locations and the combination of multiple datasets,? Biomedical is a vast field with select subtopics addressed from scanning methodologies to structural applications to biological applications,? Scalability in scientific visualization is critical as data grows and computational devices range from hand-held mobile devices to exascale computational platforms. Scientific Visualization will be useful to practitioners of scientific visualization, students interested in both overview and advanced topics, and those interested in knowing more about the visualization process.

Charles D. Hansen Min Chen Christopher R. Johnson Arie: author's other books


Who wrote Scientific visualization: uncertainty, multifield, biomedical, and scalable visualization? Find out the surname, the name of the author of the book and a list of all author's works by series.

Scientific visualization: uncertainty, multifield, biomedical, and scalable visualization — read online for free the complete book (whole text) full work

Below is the text of the book, divided by pages. System saving the place of the last page read, allows you to conveniently read the book "Scientific visualization: uncertainty, multifield, biomedical, and scalable visualization" online for free, without having to search again every time where you left off. Put a bookmark, and you can go to the page where you finished reading at any time.

Light

Font size:

Reset

Interval:

Bookmark:

Make
Part I
Uncertainty Visualization
Springer-Verlag London 2014
Charles D. Hansen , Min Chen , Christopher R. Johnson , Arie E. Kaufman and Hans Hagen (eds.) Scientific Visualization Mathematics and Visualization 10.1007/978-1-4471-6497-5_1
1. Overview and State-of-the-Art of Uncertainty Visualization
Georges-Pierre Bonneau 1
(1)
The University of Grenoble, Grenoble, France
(2)
Zuse Institute Berlin, Berlin, Germany
(3)
Scientific Computing and Imaging Institute, University of Utah, Salt Lake City, UT, USA
(4)
Instituto de Informtica, UFRGS, Porto Alegre, RS, Brazil
(5)
University of Maryland Baltimore County, Baltimore, MD, USA
(6)
University of Bonn, Bonn, Germany
(7)
MPI for Intelligent Systems, Tbingen, Germany
Georges-Pierre Bonneau (Corresponding author)
Email:
Hans-Christian Hege
Email:
Chris R. Johnson
Email:
Manuel M. Oliveira
Email:
Kristin Potter
Email:
Penny Rheingans
Email:
Thomas Schultz
Email:
Abstract
The goal of visualization is to effectively and accurately communicate data. Visualization research has often overlooked the errors and uncertainty which accompany the scientific process and describe key characteristics used to fully understand the data. The lack of these representations can be attributed, in part, to the inherent difficulty in defining, characterizing, and controlling this uncertainty, and in part, to the difficulty in including additional visual metaphors in a well designed, potent display. However, the exclusion of this information cripples the use of visualization as a decision making tool due to the fact that the display is no longer a true representation of the data. This systematic omission of uncertainty commands fundamental research within the visualization community to address, integrate, and expect uncertainty information. In this chapter, we outline sources and models of uncertainty, give an overview of the state-of-the-art, provide general guidelines, outline small exemplary applications, and finally, discuss open problems in uncertainty visualization.
What is not surrounded by uncertainty cannot be the truth .
Richard Feynman
True genius resides in the capacity for evaluation of uncertain, hazardous, and conflicting information .
Winston Churchill
1.1 Introduction
Visualization is one window through which scientists investigate, evaluate and explore available data. As technological advances lead to better data acquisition methods, higher bandwidth, fewer memory limits, and greater computational power, scientific data sets are concurrently growing in size and complexity. Because of the reduction of hardware limitations, scientists are able to run simulations at higher resolution, for longer amounts of time, using more sophisticated numerical models. These advancements have forced scientists to become increasingly reliant on data processing, feature and characteristic extraction, and visualization as tools for managing and understanding large, highly complex data sets. In addition, there is becoming a greater accessibility to the error, variance, and uncertainty not only in output results but also incurred throughout the scientific pipeline.
With increased size and complexity of data becoming more common, visualization and data analysis techniques are required that not only address issues of large scale data, but also allow scientists to understand better the processes that produce the data, and the nuances of the resulting data sets. Information about uncertainty, including confidence, variability, as well as model bias and trends are now available in these data sets, and methods are needed to address the increased requirements of the visualization of these data. Too often, these aspects remain overlooked in traditional visualization approaches; difficulties in applying pre-existing methods, escalating visual complexity, and the lack of obvious visualization techniques leave uncertainty visualization an unsolved problem.
Effective visualizations present information in a manner that encourages data understanding through the appropriate choice of visual metaphor. Data are used to answer questions, test hypotheses, or explore relationships and the visual presentation of data must facilitate these goals. Visualization is a powerful tool allowing great amounts of data to be presented in a small amount of space, however, different visualization techniques are better than others for particular types of data, or for answering specific questions. Using the most befitting visualization method based on the data type and motivated by the intended goals of the data results in a powerful tool for scientists and data analysts.
The effective visualization of uncertainty, however, is not always possible through the simple application of traditional visualization techniques. Often, the visualization of the data itself has a high visual complexity, and the addition of uncertainty, even as a scalar value, complicates the display. Issues of visual clutter, data concealment, conflicts in how the data and the uncertainty are represented, and unintentional biases are just some of the problems incurred when visualizing data accompanied by uncertainty. Also, the complexity of these data sets may not lend themselves to the straightforward application of existing visualization methods, and thus, the added burden of uncertainty can be overwhelming.
Uncertainty data are becoming more prevalent and can be found in fields such as medical imaging, geoscience, and mechanical engineering. The simulation of complex systems, compilation of sensor data, and classification of tissue type are but a few sources of uncertainty data and their expression, size, and complexity can drastically vary. Uncertainty can arise in all stages of the analysis pipeline, including data acquisition, transformation, sampling, quantization, interpolation, and visualization. It can be a single scalar value presented alongside the original data, or can be an integral aspect of the data, derived from the description of the data itself. In any case, uncertainty is an imperative component of scientific data sets and should not be disregarded in visualizations.
1.1.1 Sources of Uncertainty
Uncertainty can mean very different things in different situations, with each driven by different key characteristics and goals. The uncertainty in a data set may result from the process through which the data was gathered or generated, or it may represent variability in the phenomenon represented by the data. We divide data uncertainty sources into three broad classes: uncertainty observed in sampled data, uncertainty measures generated by models or simulations, and uncertainty introduced by the data processing or visualization processes. Variability in the underlying phenomenon could manifest itself in sampled data or be incorporated into models or simulations. A particular data set might be subject to one form of uncertainty or multiple. Different types of uncertainty offer different challenges to effective and truthful visualization. While most of the visualization literature about uncertainty concentrates on issues of visual representation rather than source, a few papers have made a thoughtful analysis of the source of uncertainty, as well []. The discussion below draws from all these sources.
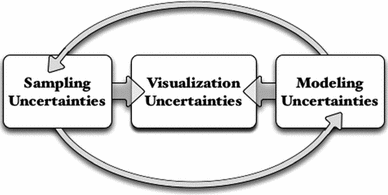
Fig 11 Sources of uncertainty Both sampling and modeling uncertainties - photo 1
Next page
Light

Font size:

Reset

Interval:

Bookmark:

Make

Similar books «Scientific visualization: uncertainty, multifield, biomedical, and scalable visualization»

Look at similar books to Scientific visualization: uncertainty, multifield, biomedical, and scalable visualization. We have selected literature similar in name and meaning in the hope of providing readers with more options to find new, interesting, not yet read works.


Reviews about «Scientific visualization: uncertainty, multifield, biomedical, and scalable visualization»

Discussion, reviews of the book Scientific visualization: uncertainty, multifield, biomedical, and scalable visualization and just readers' own opinions. Leave your comments, write what you think about the work, its meaning or the main characters. Specify what exactly you liked and what you didn't like, and why you think so.