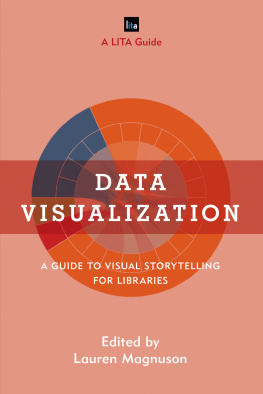
Magnuson - Data visualization a guide to visual storytelling for libraries
Here you can read online Magnuson - Data visualization a guide to visual storytelling for libraries full text of the book (entire story) in english for free. Download pdf and epub, get meaning, cover and reviews about this ebook. City: Lanham, Md, year: 2016, publisher: Rowman & Littlefield, genre: Home and family. Description of the work, (preface) as well as reviews are available. Best literature library LitArk.com created for fans of good reading and offers a wide selection of genres:
Romance novel
Science fiction
Adventure
Detective
Science
History
Home and family
Prose
Art
Politics
Computer
Non-fiction
Religion
Business
Children
Humor
Choose a favorite category and find really read worthwhile books. Enjoy immersion in the world of imagination, feel the emotions of the characters or learn something new for yourself, make an fascinating discovery.
- Book:Data visualization a guide to visual storytelling for libraries
- Author:
- Publisher:Rowman & Littlefield
- Genre:
- Year:2016
- City:Lanham, Md
- Rating:5 / 5
- Favourites:Add to favourites
- Your mark:
- 100
- 1
- 2
- 3
- 4
- 5
Data visualization a guide to visual storytelling for libraries: summary, description and annotation
We offer to read an annotation, description, summary or preface (depends on what the author of the book "Data visualization a guide to visual storytelling for libraries" wrote himself). If you haven't found the necessary information about the book — write in the comments, we will try to find it.
Magnuson: author's other books
Who wrote Data visualization a guide to visual storytelling for libraries? Find out the surname, the name of the author of the book and a list of all author's works by series.
Data visualization a guide to visual storytelling for libraries — read online for free the complete book (whole text) full work
Below is the text of the book, divided by pages. System saving the place of the last page read, allows you to conveniently read the book "Data visualization a guide to visual storytelling for libraries" online for free, without having to search again every time where you left off. Put a bookmark, and you can go to the page where you finished reading at any time.
Font size:
Interval:
Bookmark:
Data Visualization
Library Information Technology Association (LITA) Guides
Marta Mestrovic Deyrup, PhD
Acquisitions Editor, Library Information and Technology Association, a division of the American Library Association
The Library Information Technology Association (LITA) Guides provide information and guidance on topics related to cutting edge technology for library and IT specialists.
Written by top professionals in the field of technology, the guides are sought after by librarians wishing to learn a new skill or to become current in todays best practices.
Each book in the series has been overseen editorially since conception by LITA and reviewed by LITA members with special expertise in the specialty area of the book.
Established in 1966, the Library and Information Technology Association (LITA) is the division of the American Library Association (ALA) that provides its members and the library and information science community as a whole with a forum for discussion, an environment for learning, and a program for actions on the design, development, and implementation of automated and technological systems in the library and information science field.
Approximately 25 LITA Guides were published by Neal-Schuman and ALA between 2007 and 2015. Rowman & Littlefield took over publication of the series beginning in late 2015. Books in the series published by Rowman & Littlefield are:
Digitizing Flat Media: Principles and Practices
The Librarians Introduction to Programming Languages
Library Service Design: A LITA Guide to Holistic Assessment, Insight, and Improvement
Data Visualization: A Guide to Visual Storytelling for Libraries
Data Visualization
A Guide to Visual Storytelling for Libraries
Edited by Lauren Magnuson
Rowman & Littlefield
Lanham Boulder New York London
Published by Rowman & Littlefield
A wholly owned subsidiary of The Rowman & Littlefield Publishing Group, Inc.
4501 Forbes Boulevard, Suite 200, Lanham, Maryland 20706
www.rowman.com
Unit A, Whitacre Mews, 26-34 Stannary Street, London SE11 4AB
Copyright 2016 by American Library Association
All rights reserved . No part of this book may be reproduced in any form or by any electronic or mechanical means, including information storage and retrieval systems, without written permission from the publisher, except by a reviewer who may quote passages in a review.
British Library Cataloguing in Publication Information Available
Library of Congress Cataloging-in-Publication Data
Name: Magnuson, Lauren, 1986, editor.
Title: Data visualization : a guide to visual storytelling for libraries / edited by Lauren Magnuson.
Description: Lanham : Rowman & Littlefield, [2016] | Series: Library Information Technology Association (LITA) guides | Includes bibliographical references and index.
Identifiers: LCCN 2016014587| ISBN 9781442271104 (hardcover) | ISBN 9781442271128 (eBook)
Subjects: LCSH: Library scienceGraphic methods. | Library statisticsComputer programs. | Charts, diagrams, etc.Computer programs. | Information visualization. | Communication in library science. | Visual communication.
Classification: LCC Z678.93.G73 D38 2016 | DDC 020dc23 LC record available at https://lccn.loc.gov/2016014587
 The paper used in this publication meets the minimum requirements of American National Standard for Information SciencesPermanence of Paper for Printed Library Materials, ANSI/NISO Z39.48-1992.
Printed in the United States of America
Preface
Libraries are embracing the expectation that they demonstrate their effectiveness and be accountable to communities and the institutions they serve. Libraries collect mountains of raw data about how their collections and services are used, but communicating the impact of that data to a variety of audiences can be challenging. Raw data are not enoughdata must be carefully prepared and presented in a way that is understandable, transparent, and compelling. Emerging data visualization technologies provide the ability to create engaging, interactive visualizations that effectively tell the story of a librarys impact on its users.
Data visualization is interdisciplinary, combining elements of data science, statistics, visual communication, and visual design. Although emerging technologies are making it easier to create complex visualizations using large data sets, data visualization can refer to the design and creation of visuals with or without digital technology. The ultimate goal of data visualization is to help viewers understand data betterby providing context, illustrating trends, showcasing patterns, and enabling interactive exploration of data.
The purpose of this book is to provide guidance and practical-use cases to illustrate how libraries can use data visualization technologies to both understand and communicate data. Case studies in this book discuss a variety of technologies and frameworks that can be used in data visualization, including D3.js (chapter 3), Google Charts (chapters 3 and 4), and visualization libraries for the R programming language (chapters 5 and 9). To create compelling visualizations, you must first acquire a deep understanding of the underlying data. A common theme throughout this book is that a significant amount of work is required to clean, prepare, and transform data to make truly meaningful visualizations, so real-world examples of how this data preparation work can be accomplished are provided.
This book features case studies and examples that can be useful to the total visualization beginner as well as those with some experience using data visualization technologies. Whether you have just started creating visualizations using charting tools like Excel or Google Charts or you have used sophisticated front-end data visualization code libraries, you will find useful case studies and inspirational applications of visualization technologies in this book.
The scope of this book covers core principles of data preparation and visualization and describes how libraries apply data visualization technologies and strategies to improve library services, enhance accountability, and understand collections and users. Also included are practical strategies for incorporating data visualizations, data literacy, and visual literacy into information literacy and instructional services.
The book begins with Eric Phetteplaces chapter, Sculpting Data for a Successful Visualization, which provides a practical overview of methods for cleaning and preparing data for visualizations. In Designing Public Visualizations of Library Data, Angela Zoss discusses essential principles of visualization design and provides a comprehensive overview of common data visualization types and techniques.
The following chapters discuss case studies and examples of creating visualizations using data about library services, from discovery and web analytics to interlibrary loan data. In Tools and Technologies: Visualizing Research Activity in the Discovery Layer in Real Time, Godmar Back and Annette Bailey describe how they created a series of innovative visualizations to better understand and communicate search behavior in their Summon discovery system. In Using Google Tools to Create Public Analytics Visualizations, I provide a step-by-step tutorial for setting up a service that enables querying Google Analytics data for a website to create publicly accessible, constantly updating visualizations. Roger Taylor and Emily Mitchell, in Minding the Gap: Utilizing Data Visualizations for Library Collection Development, provide a comprehensive overview of how collection circulation data can be mined and visualized to provide guidance in making collection decisions. In A Picture Is Worth a Thousand Books: OBILLSK, Data Visualization, and Interlibrary Loan, Ryan Litsey, Kenny Ketner, and Scott Luker describe the creation of a tool that gathers and renders interlibrary loan data from across a library consortium to provide greater accountability for interlibrary loan services.
Next pageFont size:
Interval:
Bookmark:
Similar books «Data visualization a guide to visual storytelling for libraries»
Look at similar books to Data visualization a guide to visual storytelling for libraries. We have selected literature similar in name and meaning in the hope of providing readers with more options to find new, interesting, not yet read works.
Discussion, reviews of the book Data visualization a guide to visual storytelling for libraries and just readers' own opinions. Leave your comments, write what you think about the work, its meaning or the main characters. Specify what exactly you liked and what you didn't like, and why you think so.

