Springer-Verlag Berlin Heidelberg 2016
Hakan Ilaslan and Murali Sundaram Pediatric and Adult MRI Atlas of Bone Marrow 10.1007/978-3-642-02740-6_1
1. Normal Bone Marrow: In Utero Through the Adult Years
S. Pinar Karakas-Rothey 1 and Hakan Ilaslan 2
(1)
Department of Diagnostic Imaging, University of California San Francisco Benioff Childrens Hospital at Oakland, Oakland, CA, USA
(2)
Cleveland Clinic Department of Radiology, Cleveland Clinic Lerner College of Medicine, Cleveland, OH, USA
1.1 Hematopoiesis
Hematopoiesis, the formation of blood cells, commences and is confined to the yolk sac of the fetus for the first 6 weeks. Between the sixth and twentieth weeks of age, the reticuloendothelial system, the liver and spleen, take over the process of blood cell formation []. From then on, bone marrow remains the primary site for hematopoiesis. With advancing years, the number of sites and volume of hematopoietic bone marrow progressively decreases.
1.2 Development of Bone and Bone Marrow
The skeletal system develops from primitive mesenchymal cells that are precursors of membranous bone or cartilage. The cranium and facial bones are formed directly from the mesenchyme by intramembranous ossification. The skull base, long bones, clavicles, and vertebral column develop by endochondral ossification from cartilaginous models [].
In infants, the hematopoietic (red) marrow is composed of almost equal amounts of blood cell precursors and fat cells and supplied by a rich vascular network. The yellow marrow is primarily formed by fat cells and has a sparse blood supply. The red marrow fat cells may contain slightly greater concentrations of unsaturated fatty acids, but otherwise there is no significant difference between red and yellow marrow fat cells [].
1.3 Anatomy and Physiology
Bone marrow is one of the largest and most important organs of the body with a weight of approximately 3000 g in adult men and 2600 g in adult women [].
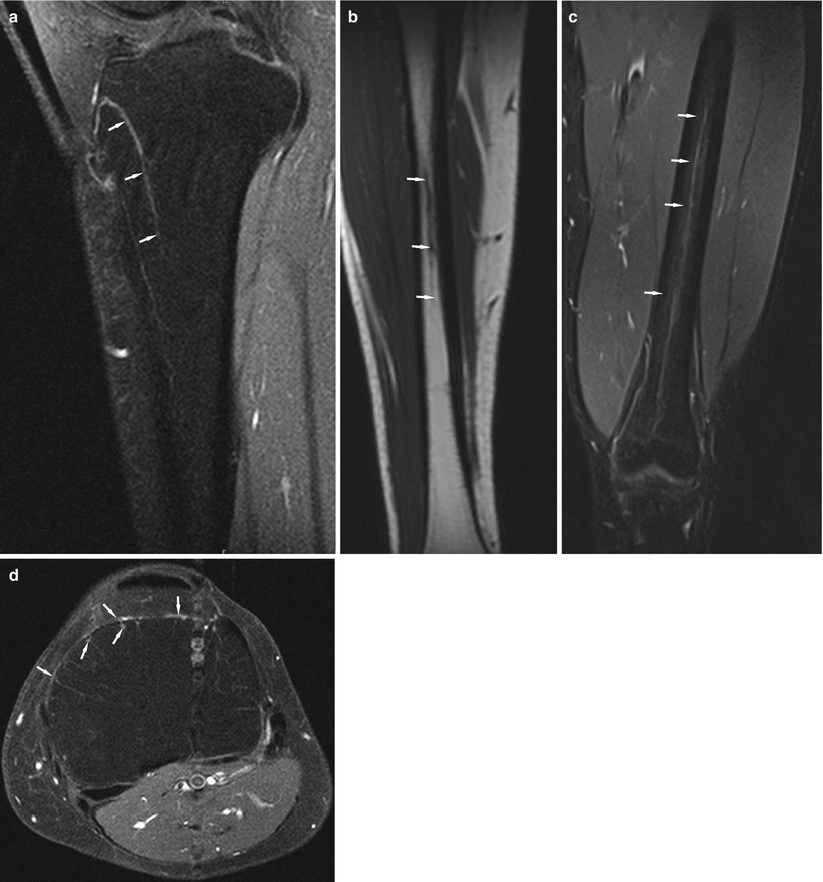
Fig. 1.1
Sagittal proton density-weighted image of the proximal tibia ( a ) shows nutrient artery penetrating the medullary cavity ( arrows ). Coronal T1-weighted image of the tibia ( b ) and coronal T2-weighted image of the femur ( c ) show nutrient artery running parallel to the long axis of these bones ( arrows ). Axial proton density-weighted image of the proximal tibia ( d ) shows branches of the nutrient artery that enter the endosteal surface of the cortex and communicate with periosteal vessels ( arrows )
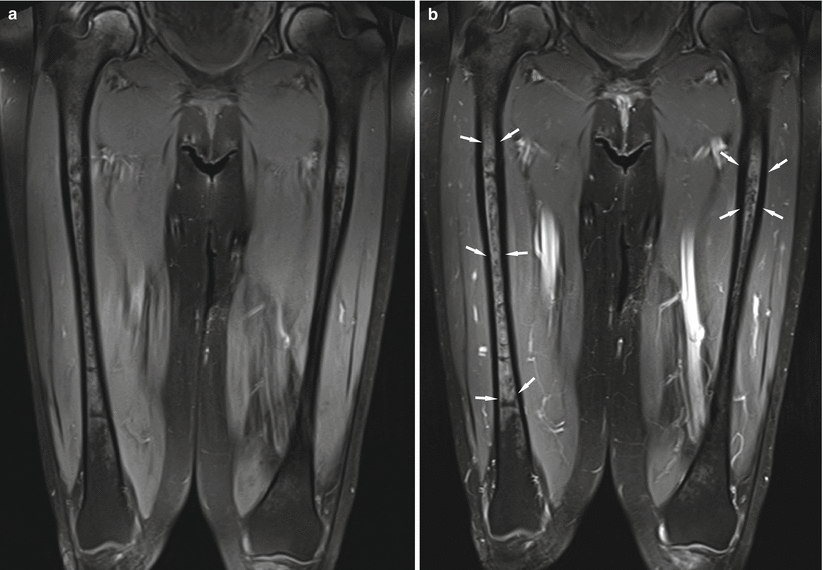
Fig. 1.2
Coronal precontrast T1-weighted fat-suppressed image of bilateral thighs shows red marrow in bilateral femoral diaphysis ( a ). After the administration of intravenous contrast, a subtle enhancement of bone marrow is noted ( b ), corresponding to areas of red marrow seen in the precontrast image ( arrows )
Fig. 1.3
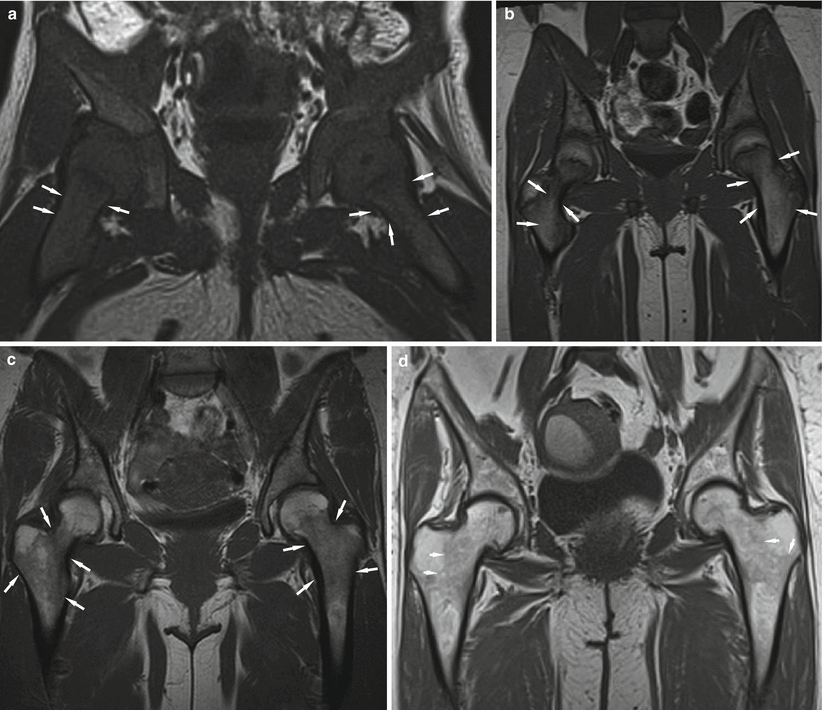
Coronal T1-weighted images of the pelvis in different ages. A 6-month-old girl ( a ), an 8-year-old girl ( b ), a 45-year-old woman ( c ), and an 88-year-old woman ( d ) all show varying degrees of red marrow ( arrows ). Note the changing hyperintensity of red marrow correlating with the ages of individuals, which reflects the increase in fatty elements within hematopoietic marrow
1.4 MRI of the Normal Appendicular Skeleton
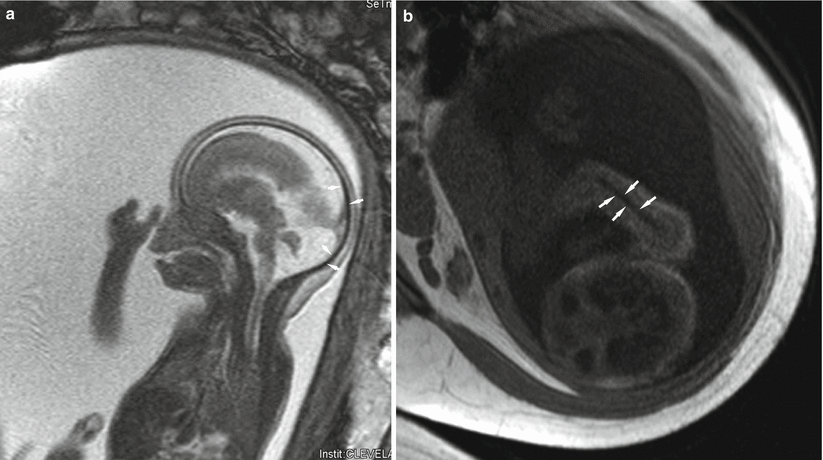
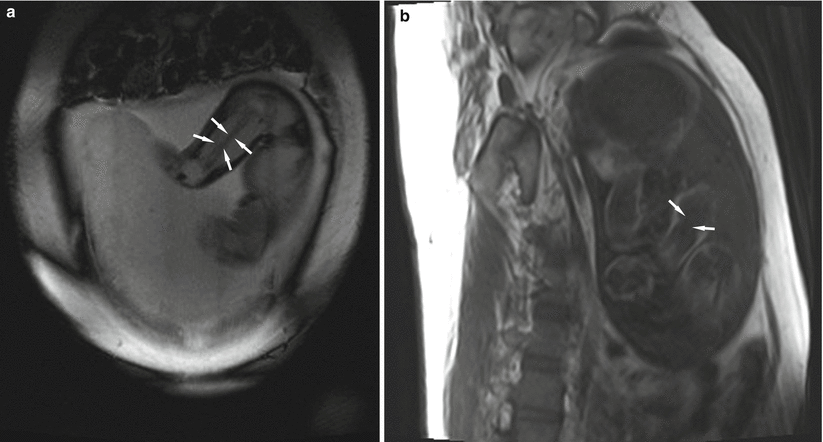
In the second trimester of pregnancy, the long bone shafts of the fetus have small medullary cavities and thick cortices giving an overall low T1 and T2 signal intensity due to a large ossified component of bone and a tiny marrow cavity which may be difficult to visualize [].
Fig. 1.4
MRI in a 20-week-old fetus. Images obtained using TrueFISP technique (true fast imaging with steady-state precession) show prominent cortices ( arrows ) without appreciable bone marrow about the skull ( a ) and humerus ( b )
Fig. 1.5
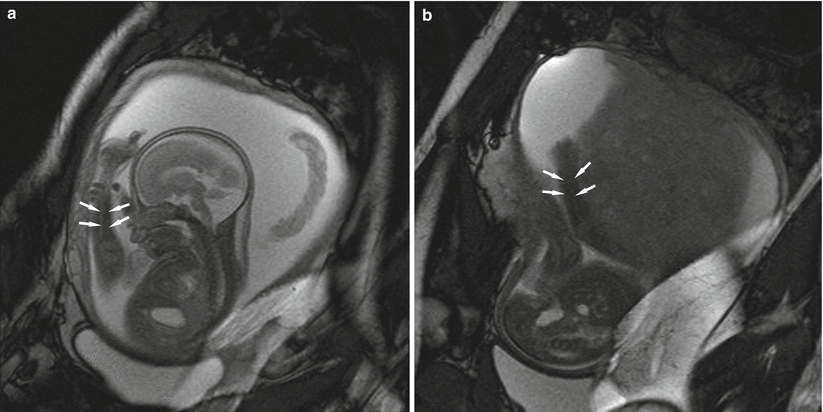
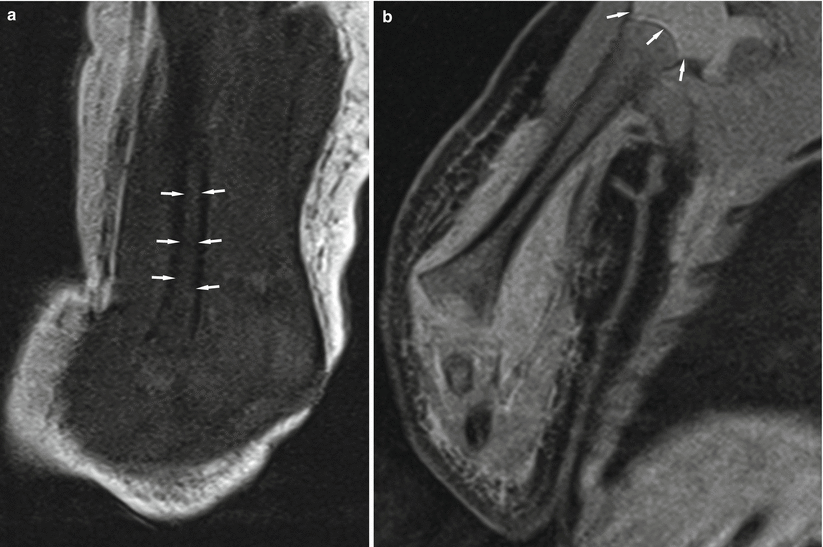
MRI in a 25-week-old fetus. Images obtained using TrueFISP technique show subtle bone marrow signal ( arrows ) about femur ( a ) and forearm ( b )
Fig. 1.6
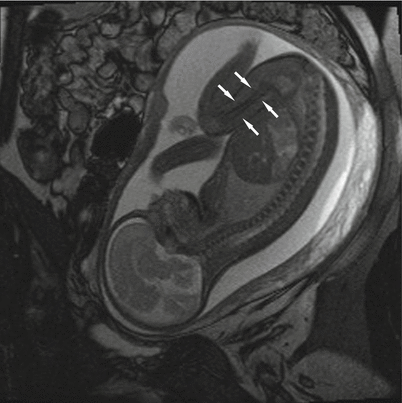
MRI in a 28-week, 2-day-old fetus. Images obtained using TrueFISP technique show obvious bone marrow signal ( arrows ) about the femur
Fig. 1.7
MRI in a 33-week, 2-day-old fetus. Humeral bone marrow signal ( arrows ) is visualized on images obtained using TrueFISP technique ( a ) and T1-weighted image ( b )
Fig. 1.8
MRI in a 2-day-old neonate. Prominent red marrow signal is noted in the humeral shaft with signal intensity ( arrows ) isointense to adjacent skeletal muscle on T1-weighted coronal image ( a ). Bone marrow appears slightly hyperintense on T2-weighted coronal image ( b ). Note the more hyperintense signal in the cartilaginous proximal humeral epiphysis
Fig. 1.9
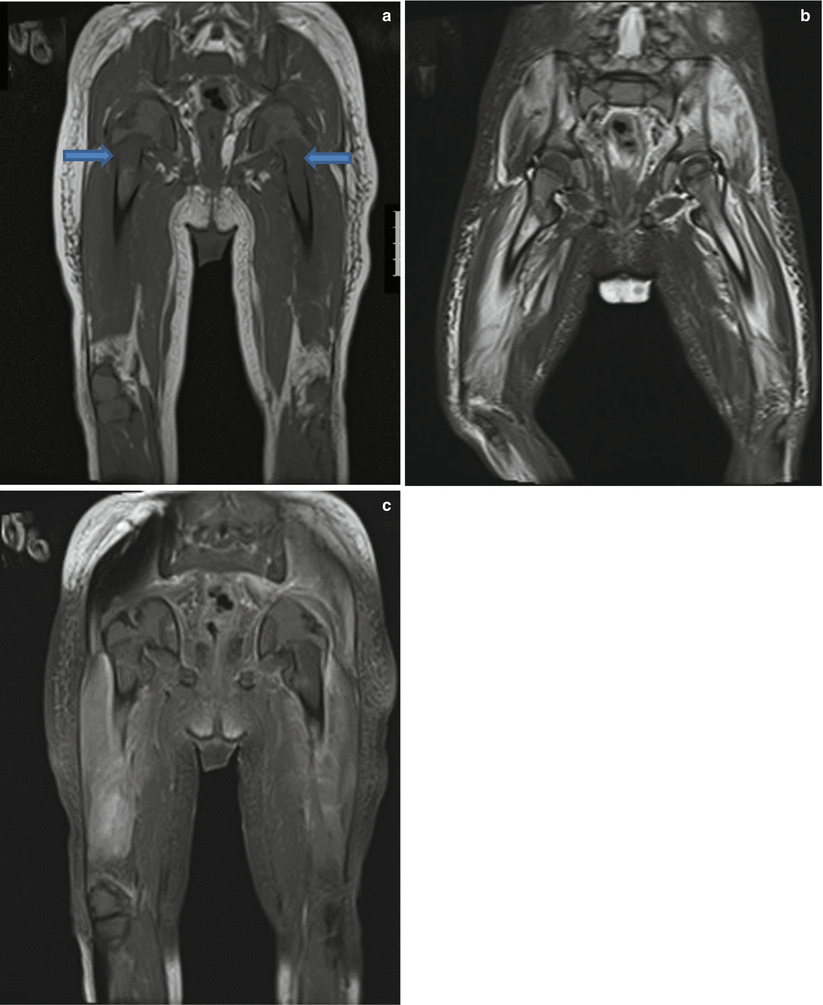
A 2-year-old boy presented with difficulty in walking. MRI of the pelvis and thighs demonstrates symmetrical abnormal bone marrow signal in pelvis and femurs. On T1-weighted images ( a ), the bone marrow signal is lower than that of adjacent skeletal muscle, suggestive of an infiltrative pathologic marrow state ( arrows ). T2-weighted fat-suppressed ( b ) image shows hyperintense marrow signal and muscle edema. Mild diffuse bone marrow and muscle enhancement is noted on postcontrast T1-weighted fat-suppressed image ( c ). A biopsy revealed acute lymphoid leukemia
In the early months of life, the cartilaginous epiphyses have higher signal intensity than the metaphysis (Fig. ) although diffuse involvement is not considered normal and typically is seen in significant chronic anemic states such as the hereditary hemoglobinopathies.
Fig. 1.10
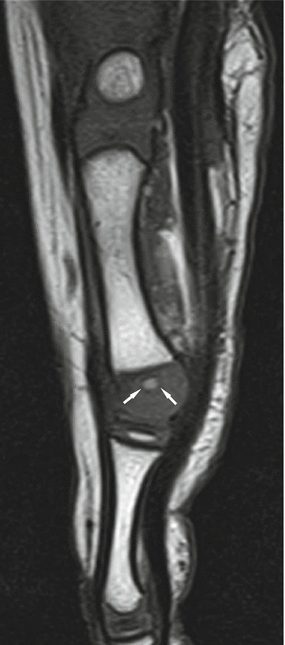
A 3-year-old boy. Sagittal T1-weighted image of the foot shows a focus of fatty marrow formation within cartilaginous epiphyses of the metatarsal proximally and distally ( arrows )

