Palani Murugappan - Microsoft Excel Statistical and Advanced Functions for Decision Making
Here you can read online Palani Murugappan - Microsoft Excel Statistical and Advanced Functions for Decision Making full text of the book (entire story) in english for free. Download pdf and epub, get meaning, cover and reviews about this ebook. year: 2014, publisher: Blue Micro Solutions, genre: Computer. Description of the work, (preface) as well as reviews are available. Best literature library LitArk.com created for fans of good reading and offers a wide selection of genres:
Romance novel
Science fiction
Adventure
Detective
Science
History
Home and family
Prose
Art
Politics
Computer
Non-fiction
Religion
Business
Children
Humor
Choose a favorite category and find really read worthwhile books. Enjoy immersion in the world of imagination, feel the emotions of the characters or learn something new for yourself, make an fascinating discovery.

- Book:Microsoft Excel Statistical and Advanced Functions for Decision Making
- Author:
- Publisher:Blue Micro Solutions
- Genre:
- Year:2014
- Rating:3 / 5
- Favourites:Add to favourites
- Your mark:
Microsoft Excel Statistical and Advanced Functions for Decision Making: summary, description and annotation
We offer to read an annotation, description, summary or preface (depends on what the author of the book "Microsoft Excel Statistical and Advanced Functions for Decision Making" wrote himself). If you haven't found the necessary information about the book — write in the comments, we will try to find it.
Palani Murugappan: author's other books
Who wrote Microsoft Excel Statistical and Advanced Functions for Decision Making? Find out the surname, the name of the author of the book and a list of all author's works by series.


Microsoft Excel Statistical and Advanced Functions for Decision Making — read online for free the complete book (whole text) full work
Below is the text of the book, divided by pages. System saving the place of the last page read, allows you to conveniently read the book "Microsoft Excel Statistical and Advanced Functions for Decision Making" online for free, without having to search again every time where you left off. Put a bookmark, and you can go to the page where you finished reading at any time.
Font size:
Interval:
Bookmark:
PREFACE
Hi all!
Welcome to Microsoft Excel Statistical and Advanced Functions for Decision Making!
Most of you probably know how to use Excel. How many can handle the above functions and features mentioned? This is the book for you if you want to learn the advanced Excel functions.
This book was written to help any users wanting to have a good grasp on the advanced functions and an analysis of the various statistical tools for the purpose of decision making. It goes further by introducing the concepts of filters, estimation and forecasting, data validation, conditional formatting, goal seek, using the solver, and finally, pivot tables and pivot charts.
Many books have been written on Excel. However, this book explains most of the advanced functions and features in a rather simplified manner with plenty of screen captures wherever possible. New users and existing users on Excel will find this book handy.
So, why wait? Get a head start with Microsoft Excels advanced functions for the purpose of decision making.
Palani Murugappan
Email : palani12@yahoo.com
A short introduction to statistics
This book emphasizes on the use of statistical functions for the purpose of decision making. While every attempt is made as not to get too technical, it would be wise for any reader to brush up on some of the basic terminology and understanding of what statistics is all about.
The very mention of the word statistics tends to get many to avoid this topic. However, in this book, attempt is made to link and show how you can use some of the more commonly used phrases such as standard deviation, regression, correlation, linear and exponential growth, etc in terms on analyzing data using the software Microsoft Excel. Wherever possible, Excel is used to show how you can use some of its built-in functions to perform data analysis and interpret the results.
Many out there are extremely good at performing number crunching calculations but most are unable to interpret the results. For example, when given a raw set of data, how then do you try to establish if a relationship or pattern exists? What tools will you use? To answer these questions, Excel can perform most of the analysis but the interpretation still has to come from the user.
Another example is when you have collected data on sales figures based on week days and the temperature outside, you can perform analysis as to check if there exists a relationship on the sales based on the week day or temperature i.e. do people buy more on certain days or do people buy less when the temperature drops. These questions can be answered when an analysis is performed. This is an example of modeling and Excel can be used to perform much of the calculations.
Furthermore, you can also perform comparative analysis such as a what if condition and highlight some of the cells when a positive or negative results occur. All this and much more will be shown in this book.
Why statistics?
To be competitive, a business must design its products to be of certain quality and robust. For a product to fall in this category, the processes involved in making the product must facilitate a never ending improvement (what is known as gemba kaizen in Japanese which literally means continuous improvement. Toyota applies this principle in all of its manufacturing plant across the globe) at all stages of manufacturing beginning from the design stage.
One strategy to ensure that this is a success is to employ statistical methods such as statistically designed experiments and produce processes that provide high yield with low failure or reject rate. A well planned statistical study can reduce much of the obstacles or hindrances to high quality production which saves time and money. This is where the use of cost effective experiments can prove useful in improvising and optimizing products and processes.
Statistics can help you in making decisions under uncertainties based on some numerical and measurable scales. A decision making process can only be made when relevant data is available, not on personal belief or opinion. Where then do you get the relevant data? This is where knowledge on data collection method is important. Once the data is collected, it can be compiled and analyzed as information. With much information, it can be turned to facts and finally facts to knowledge.
Let us look around us. How often does any manufacturing company embark on a project without an initially study on the marketability and demand of the product, quality, design, and pricing issues? This is where the compilation of data is required to study the analysis of the data before proceeding with the design and making the product finally. Of course there is still no guarantee that the product will be a success! This is where statistics comes in to reduce much of the uncertainties involved. It should be noted that a clear mind and thinking is more important than the ability to perform the actual calculation.
As statistics involves much data, it is important to examine the distribution of data to detect important characteristics such as shape, variability and unusual shapes by plotting the data. By further observing the data, you can come to a conclusion observing the patterns in a data. For example, if the data (assuming sales data) is upward rising, you can conclude that sales is on the rise as compared to time.
Again, when you plot the data gathered, you may find that there are a few points that deviate to a great extent from the line of best fit i.e. a straight line that best describes the data. These few points can be recorded wrongly at source or when someone tries to key the data into a software application.
Thus, it is important for data to be collected based on a well developed plan and questions be closed ended i.e. giving interviewees multiple choice questions rather than open ended questions such as giving their personal views. The reason for this is it will be easier to tabulate and measure closed ended questions later and draw a conclusion based on it. From the data collected, a statistical model can be formulated where inferences can be drawn.
A sample process of data gathering and interpreting to a conclusion is as follows:
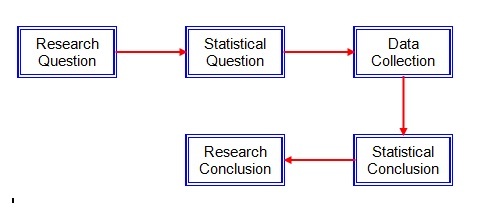
Statistics especially business statistics is the science of good decision making in the face of much uncertainties and is used widely in disciplines such as financial analysis, auditing, econometrics, production, operations, and marketing research. It provides knowledge and skills to interpret and use statistical tools and techniques in many different business applications. Types of data
Before proceeding to the other parts, it may be useful to know and understand the various types of data that you may be dealing or in the future.
Data can be classified into quantitative data or qualitative data.
Quantitative data is generally used to measure either how much or how many of something. For example, in a set of observations, a single observation is a number that represents an amount or a count.
Quantitative data can be divided into discrete or continuous variables. Discrete variables are any possible individual values such as counting values beginning with 1, 2, 3, etc. Continuous variables are a set of values that has an interval between them such as 1-5, 6-10, 11-15, 16-20, etc.
Qualitative data allows for the provision of names or labels for categories of like items. For example, in a set of observations, any single observation represents a class or category. Qualitative data can usually be measured.
For a start, qualitative data can be classified into one of the three categories i.e.
Font size:
Interval:
Bookmark:
Similar books «Microsoft Excel Statistical and Advanced Functions for Decision Making»
Look at similar books to Microsoft Excel Statistical and Advanced Functions for Decision Making. We have selected literature similar in name and meaning in the hope of providing readers with more options to find new, interesting, not yet read works.
Discussion, reviews of the book Microsoft Excel Statistical and Advanced Functions for Decision Making and just readers' own opinions. Leave your comments, write what you think about the work, its meaning or the main characters. Specify what exactly you liked and what you didn't like, and why you think so.