Table Contents
Copyright 2020
Copyright Protection
All rights rsrvd. No part f this publication may b rprducd, distributed, or transmitted in any form or by any means, including phtcpying, recording, or thr lctrnic or mechanical methods, without the prior written permission of the publisher, xcpt in the case of brief quotations mbdid in critical reviews and certain thr nn-cmmrcial uses permitted by copyright law.
Chapter 1: Introduction
Excel has many tools and functions at its disposal but it can be argued that many of its features are not used or underutilised. One good example of this are pivot tables. Pivot tables have been around for over 20 years but many Excel users who hear the word pivot table turn the other way, thinking it is too difficult to learn and understand.
I wrote this book with the goal of showing you how easy it is to create pivot tables and use its available features. This book will teach you all the essential information about pivot tables from what they are and how to build them through to how to create pivot charts. This book can be used as a quick reference guide or a tutorial and includes easy to follow step by step instructions with lots of screenshots so you can follow along easily.
Who is this Book Aimed For?
This book is aimed for people who:
- Are familiar with Excel and know how to open and save workbooks, enter data in worksheets and have a general familiarity with the Excel ribbon and its tools
- Want to learn how to analyse large data sets quickly and easily
- Have never used pivot tables before and would like to learn
- Have used pivot tables occasionally but would like to learn more about them
- Want to learn how to create charts to analyse data better
Version Used
I have written this book using Excel 2013 but you can follow along if you have Microsoft Excel 2007, 2010 or 2016.
Structure of the Book
The book is structured in a logical way so you build your knowledge and gain more understanding on pivot tables as you go through chapter by chapter. It is recommended that you read the book from start to finish, especially if you are a beginner.
The beginning of the book will teach you the basics such as what pivot tables are and how to create one. Once you have created a pivot table, the middle section will teach you how to customise and format a pivot table so it can be easily interpreted and understood. You will also learn more advanced features as you go through the book such as adding calculations to a pivot table using calculated fields and calculated items. Later in the book you will learn about how to reference cells in a pivot table, how to add slicers to filter a pivot table and how to create pivot charts to easily analyse your data.
How to use this Book
As mentioned in the previous section, it is recommended that you read the book from start to finish if you are a beginner as I will use examples from the previous chapter. However, if you have used pivot tables before and would like to learn about a specific tool or function of a pivot table then you can go to that specific chapter first.
Finally, I hope you enjoy reading this book. The more practice you do in creating pivot tables, the easier it will become and you will be able to create them in no time. If you would like to contact me then please visit my website www.excelmasterconsultant.com and send me a comment using the contact form.
Chapter 2: Introduction to Pivot Tables
Pivot Tables are one of the most powerful features in Excel. They were invented in 1986 by Pito Salas who was working for Lotus Corp at the time. It became more prominent in the early 1990s when Lotus Improv was released for the NeXT platform in 1991. It soon became one of the must know features in Excel, especially if you are analysing large data sets. Before we delve into how to create pivot tables, it is important to know what it actually is.
What is a Pivot Table?
A pivot table is essentially a data summary tool which is created from a data source. You can summarise data in seconds by simply clicking and dragging fields from one area of the report to another. It can transform hundreds and thousands of rows and columns into meaningful information. You can display subtotals on any level of data you want. Arguably the biggest advantage of using pivot tables is in its interactivity. You can rearrange information without any effort. In fact, the reason why they are called pivot tables is because you can pivot the data in any way you choose.
Why use Pivot Tables?
So why should you use a pivot table? A pivot table should be used if you want to summarise large amounts of data. If you try and summarise the information with Excel formulas it will be more time consuming as you have to manually write the formulas. If you add more information to your data then you may have to edit your formulas which can also be time consuming. Pivot tables can easily be formatted to make them attractive and visually appealing whereas with manually created tables with formulas in, it can take longer to format. If you have a very large data set which is made up of hundreds of thousands of rows and columns then using formulas to summarise your information will slow down the Excel calculation time. Whenever you make a change to your data, the formulas will take a while to recalculate. With a pivot table you will not have any problems with slow calculation times.
Pivot Table Layout
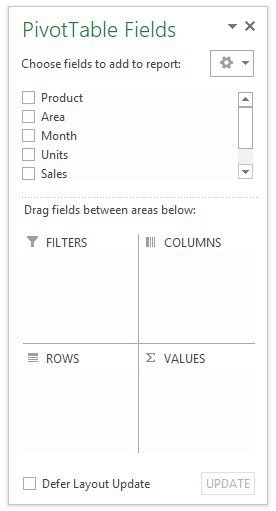
There are four components of a pivot table which are contained in the Pivot Table Fields pane. The Pivot Table Fields is a task pane which is associated with the pivot table and by default is located on the right side of the window. The four components of a pivot table are:
1) Filters
2) Rows
3) Columns
4) Values
In the below screenshot, there are five fields (Product, Area, Month, Units, Sales). These are the column headings in the source data. Your pivot table appearance and information will be defined by what fields you enter in the four areas of the Pivot Table Fields pane. Now I will explain each area in turn.
Filters
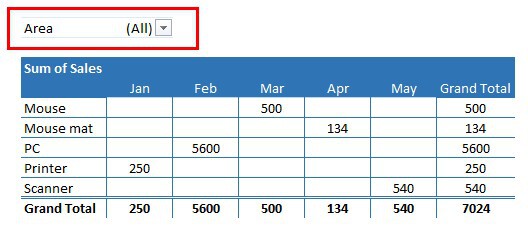
Filters allow you to display just the data you want to see and the rest of the data will be hidden. When you move a field in the Filters area you can then choose which items in the field you want to see or not see by checking or unchecking the boxes. They work in the same way as a filter in a table. In the example below, the Area field is the filter.
Rows
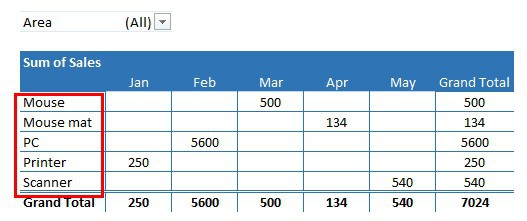
Rows show each item in the field in separate rows. One field item occupies one row. They go down the left side of the pivot table. In the example below, the Product field is in the Rows area and the items in the Product field are displayed in each row.
Columns
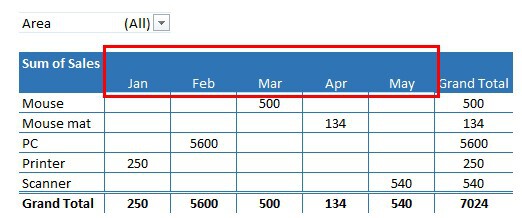
Columns shows each item in the field across separate columns. In the example below, the Month field is in the Columns area and each item in the Month field are in separate columns.
Values


