Brian Suda&King John - 2017 European data science salary survey
Here you can read online Brian Suda&King John - 2017 European data science salary survey full text of the book (entire story) in english for free. Download pdf and epub, get meaning, cover and reviews about this ebook. City: Europe., Sebastopol, CA, year: 2017, publisher: OReilly Media, Inc., genre: Home and family. Description of the work, (preface) as well as reviews are available. Best literature library LitArk.com created for fans of good reading and offers a wide selection of genres:
Romance novel
Science fiction
Adventure
Detective
Science
History
Home and family
Prose
Art
Politics
Computer
Non-fiction
Religion
Business
Children
Humor
Choose a favorite category and find really read worthwhile books. Enjoy immersion in the world of imagination, feel the emotions of the characters or learn something new for yourself, make an fascinating discovery.
- Book:2017 European data science salary survey
- Author:
- Publisher:OReilly Media, Inc.
- Genre:
- Year:2017
- City:Europe., Sebastopol, CA
- Rating:3 / 5
- Favourites:Add to favourites
- Your mark:
2017 European data science salary survey: summary, description and annotation
We offer to read an annotation, description, summary or preface (depends on what the author of the book "2017 European data science salary survey" wrote himself). If you haven't found the necessary information about the book — write in the comments, we will try to find it.
Get a clear picture of the salaries and bonuses data science professionals around the world receive, as well as the tools and cloud providers they use, the tasks they perform, and how interpersonal (soft) skills might affect their pay. The fifth edition of OReillys online Data Science Salary Survey provides complete results from nearly 800 participants from 69 different countries, 42 different US states, and Washington, DC.
With five years of data, the surveys results are consistent enough to reliably identify changes and trends. The survey asked specific questions about industry, team, and company size, but also posed questions such as, How easy is it to move to another position? or What is your next career step? You can plug in your own data points to the survey model and see how you compare to other data science professionals in your industry.
With this report, youll learn:
- Where data scientists make the highest salariesby country and by US state
- Tools that respondents most commonly use on the job, and tools that contribute most to salary
- Activities that contribute to higher earnings
- How gender and bargaining skills affect salaries when all other factors are equal
- Salary differences between those using open source tools vs those using proprietary tools
- How the increase in respondents outside of the US signal a rise in international companies starting and growing data organizations
Participate in the 2018 Survey: Spend just 5 to 10 minutes and take the anonymous salary survey here: https://www.oreilly.com/ideas/take-the-data-science-salary-survey.
Brian Suda&King John: author's other books
Who wrote 2017 European data science salary survey? Find out the surname, the name of the author of the book and a list of all author's works by series.


2017 European data science salary survey — read online for free the complete book (whole text) full work
Below is the text of the book, divided by pages. System saving the place of the last page read, allows you to conveniently read the book "2017 European data science salary survey" online for free, without having to search again every time where you left off. Put a bookmark, and you can go to the page where you finished reading at any time.
Font size:
Interval:
Bookmark:
2017 DATA SCIENCE SALARY SURVEY
by Brian Suda
Editor: Colleen Torporek
Designer: Ellie Volckhausen
Production Editor: Shiny Kalapurakkel
Copyright 2017 OReilly Media, Inc. All rights reserved.
Printed in Canada.
Published by OReilly Media, Inc., 1005 Gravenstein Highway North, Sebastopol, CA 95472.
OReilly books may be purchased for educational, business, or sales promotional use. Online editions are also available for most titles (.
2017-08-25. First Edition
ISBN: 978-1-491-97750-7
REVISION HISTORY FOR THE FIRST EDITION
2017-08-25: First Release
While the publisher and the author have used good faith efforts to ensure that the information and instructions contained in this work are accurate, the publisher and author disclaim all responsibility for errors or omissions, including without limitation responsibility for damages resulting from the use of or reliance on this work. Use of the information and instructions contained in this work is at your own risk. If any code samples or other technology this work contains or describes is subject to open source licenses or the intellectual property rights of others, it is your responsibility to ensure that your use thereof complies with such licenses and/or rights.
As data analysts and engineersas professionals who like nothing better than petabytes of rich datawe find ourselves in a strange spot: we know very little about ourselves. But thats changing. This salary and tools survey is the fifth in an annual series. To keep the insights flowing, we need one thing: PEOPLE LIKE YOU TO TAKE THE SURVEY.
Anonymous and secure, the survey will continue to provide insight into the demographics, work environments, tools, and compensation of practitioners in our field. We hope youll consider it a civic service and participate today.

HERE WE TAKE A DEEP DIVE INTO THE RESULTS FROM RESPONDENTS, EXPLORING CAREER DETAILS AND FACTORS THAT INFLUENCE SALARY
YOU CAN PRESS ACTUAL BUTTONS (and earn our sincere gratitude) by taking the 2018 surveyit only takes about 5 to 10 minutes, and is essential for us to continue to provide this kind of research. oreilly.com/ideas/take-the-data-science-salary-survey
IN THIS FIFTH EDITION OF the OReilly Data Science Salary Survey, we analyze input from nearly 800 participants from 69 countries, 42 US states, and Washington, DC. We explore everything from salaries and bonuses to tools, cloud providers, and reporting. We also investigate how interpersonal skills aka soft skillsmight be affecting salaries.
Key findings include the following:
We tie the drop in share of US respondents to a rise in international companies starting and growing their data organizations.
Those who self-assess as having the best bargaining skills make substantially more than others.
The larger the company, the higher the salary.
Python usage is up: 63% from last years 58%.
Although two-thirds of respondents use Windows to accomplish at least some of their work, thats down from 74% last year.
Spark and Spark MLlib are gaining in popularity, and worth keeping an eye on.
Global median salary is $90,000 (USD).
With five years of data, our results are consistent enough to reliably identify change and trends. When we see an increase in, for example, the popularity of a programming language, we can recognize a real change in the data ecosystem, and one to which its worth paying attention. There are a few surprises this year, but most of the data is consistent with past results.
We analyze input from nearly 800 participants from 69 countries, 42 US states, and Washington, DC.
THIS IS THE FIFTH YEAR for the Data Science Salary Survey, and we certainly see some trends over that time. With nearly 800 participants taking this online, self-reported survey, we can use this data to get a better picture of what tools data scientists are using, where the industry is heading, and most important, get an overview of salaries for the data community. The respondents came from 69 countries and 42 US states. This gives us a good geographic dispersion when we look at the trends.
The survey asked specific questions about salary, industry, team, and company size, but it also asked questions such as, How easy is it to move to another position? or What is your next career step? When all of these questions are put together, a better picture of the overall landscape comes into focus when looking at data in various industries.
The data and model are best used to start a larger discussion about, for instance, how you compare to your peers and the industry as a whole, and the soft and hard skills you might think about acquiring in order to stay competitive and up-to-date.
In the horizontal bar charts throughout this report, we include the interquartile range (IQR) to show the middle 50% of respondents answers to questions such as salary. One quarter of the respondents have a salary below the displayed range, and one quarter have a salary above the displayed range.
The IQRs are represented by colored, horizontal bars. On each of these colored bars, the white vertical band represents the median value.
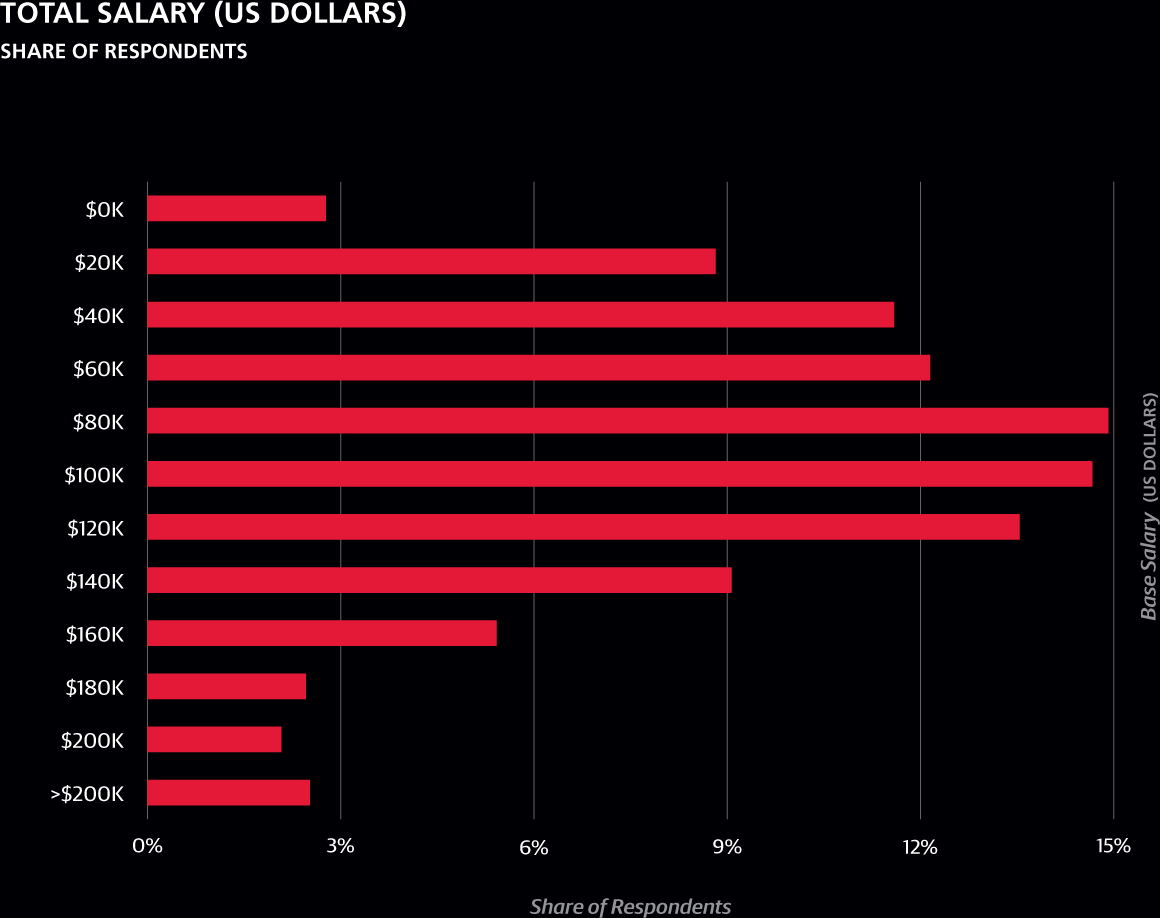
THE DISTRIBUTION OF SALARIES SKEWS TO THE RIGHT; that is, compared to a symmetric distribution, there are more people making extreme amounts on the high end of the scale. To compensate for that skew, we use median income as the best overall salary measure. For the 2017 survey, we find a median of $90,000, which is up $5,000 compared to last years median income of $85,000.
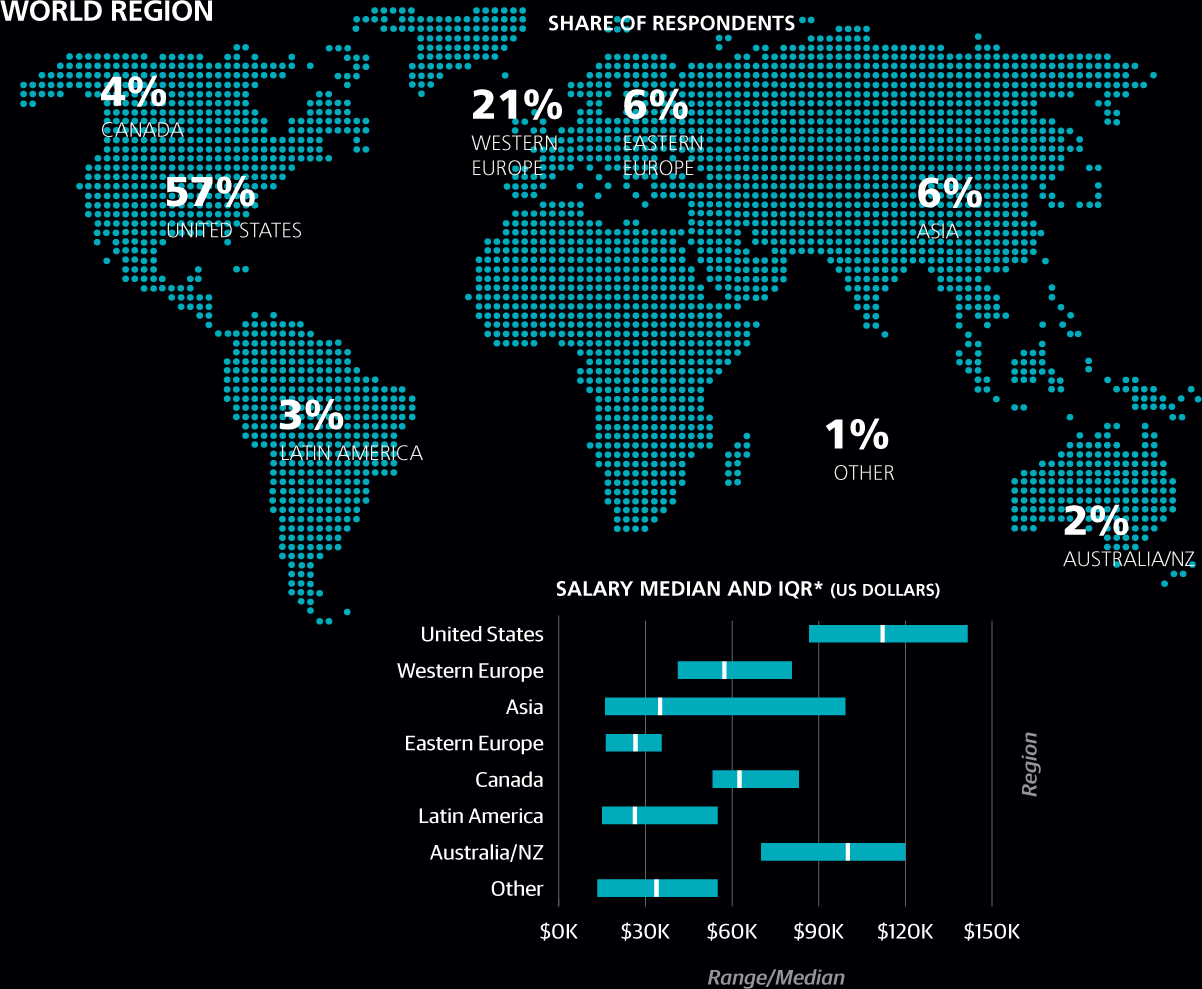
It is no surprise that the US has the highest median salaries of any region, coming in at $112,000 (up 6.7% over last year), with 57% of respondents. That salary is nearly double that of the Western European average of $57,000. This phenomenon might be due to several factors; for instance, the value of the UK pound has nosedived compared to the dollar this year, the value of the Euro has also declined, and some respondents might report their salary in local currency rather than converting to US dollars.
Australia and New Zealand have a healthy data culture; the two countries are second highest in pay, with a $100,000 median salary. Eastern Europe shows the lowest median salary, $27,000, but only 5.8% respondents.
Australia and New Zealand have a healthy data culture; the two countries are second highest in pay, with a $100,000 median salary
Font size:
Interval:
Bookmark:
Similar books «2017 European data science salary survey»
Look at similar books to 2017 European data science salary survey. We have selected literature similar in name and meaning in the hope of providing readers with more options to find new, interesting, not yet read works.
Discussion, reviews of the book 2017 European data science salary survey and just readers' own opinions. Leave your comments, write what you think about the work, its meaning or the main characters. Specify what exactly you liked and what you didn't like, and why you think so.