Roger Magoulas - 2016 Data Science Salary Survey
Here you can read online Roger Magoulas - 2016 Data Science Salary Survey full text of the book (entire story) in english for free. Download pdf and epub, get meaning, cover and reviews about this ebook. City: Place of publication not identified, year: 2016, publisher: OReilly Media, Inc., genre: Politics. Description of the work, (preface) as well as reviews are available. Best literature library LitArk.com created for fans of good reading and offers a wide selection of genres:
Romance novel
Science fiction
Adventure
Detective
Science
History
Home and family
Prose
Art
Politics
Computer
Non-fiction
Religion
Business
Children
Humor
Choose a favorite category and find really read worthwhile books. Enjoy immersion in the world of imagination, feel the emotions of the characters or learn something new for yourself, make an fascinating discovery.

- Book:2016 Data Science Salary Survey
- Author:
- Publisher:OReilly Media, Inc.
- Genre:
- Year:2016
- City:Place of publication not identified
- Rating:5 / 5
- Favourites:Add to favourites
- Your mark:
2016 Data Science Salary Survey: summary, description and annotation
We offer to read an annotation, description, summary or preface (depends on what the author of the book "2016 Data Science Salary Survey" wrote himself). If you haven't found the necessary information about the book — write in the comments, we will try to find it.
Abstract: In this fourth edition of OReillys Data Science Salary Survey, 983 respondents working across a variety of industries answered questions about the tools they use, the tasks they engage in, and the salaries they make. This years survey includes data scientists, engineers, and others in the data space from 45 countries and 45 US states. The 2016 survey included new questions, most notably about specific data-related tasks that may affect salary. Plug in your own data points to the survey model and see how you compare to other data science professionals in your industry. With this report, youll learn: Where data scientists make the highest salaries-by country and by US state Tools that respondents most commonly use on the job, and tools that contribute most to salary Two activities that contribute to higher earnings among respondents How gender and bargaining skills affect salaries when all other factors are equal Salary differences between those using open source tools vs those using proprietary tools Salary differences between those who rely on Python vs those who use several tools Participate in the 2017 Survey The survey is now open for the 2017 report. Spend just 5 to 10 minutes and take the anonymous salary survey here: https://www.oreilly.com/ideas/take-the-2017-data-science-salary-survey
Roger Magoulas: author's other books
Who wrote 2016 Data Science Salary Survey? Find out the surname, the name of the author of the book and a list of all author's works by series.
2016 Data Science Salary Survey — read online for free the complete book (whole text) full work
Below is the text of the book, divided by pages. System saving the place of the last page read, allows you to conveniently read the book "2016 Data Science Salary Survey" online for free, without having to search again every time where you left off. Put a bookmark, and you can go to the page where you finished reading at any time.
Font size:
Interval:
Bookmark:
by John King and Roger Magoulas
Copyright 2016 OReilly Media. All rights reserved.
Printed in Canada.
Published by OReilly Media, Inc. , 1005 Gravenstein Highway North, Sebastopol, CA 95472.
OReilly books may be purchased for educational, business, or sales promotional use. Online editions are also available for most titles (http://oreilly.com/safari). For more information, contact our corporate/institutional sales department: 800-998-9938 or corporate@oreilly.com .
- Editor: Shannon Cutt
- Production Editor: Colleen Cole
- Designers: Ron Bilodeau and Ellie Volckhausen
- Cover Designer: Karen Montgomery
- November 2013: First Edition.
- November 2014: Second Edition.
- September 2015: Third Edition.
- August 2016: Fourth Edition.
- 2016-08-29: First Release
The OReilly logo is a registered trademark of OReilly Media, Inc. 2016 Data Science Salary Survey, the cover image, and related trade dress are trademarks of OReilly Media, Inc.
While the publisher and the authors have used good faith efforts to ensure that the information and instructions contained in this work are accurate, the publisher and the authors disclaim all responsibility for errors or omissions, including without limitation responsibility for damages resulting from the use of or reliance on this work. Use of the information and instructions contained in this work is at your own risk. If any code samples or other technology this work contains or describes is subject to open source licenses or the intellectual property rights of others, it is your responsibility to ensure that your use thereof complies with such licenses and/or rights.
978-1-491-96513-9
[TI]
IN THIS FOURTH EDITION of the OReilly Data ScienceSalary Survey, weve analyzed input from 983 respondentsworking in the data space, across a variety of industriesrepresenting 45 countries and 45 US states. Through theresults of our 64-question survey, weve explored which toolsdata scientists, analysts, and engineers use, which tasks theyengage in, and of coursehow much they make.
Key findings include:
- Python and Spark are among the tools that contributemost to salary.
- Among those who code, the highest earners are the oneswho code the most.
- SQL, Excel, R and Python are the most commonly usedtools.
- Those who attend more meetings, earn more.
- Women make less than men, for doing the same thing.
- Country and US state GDP serves as a decent proxy forgeographic salary variation (not as a direct estimate, butas an additional input for a model).
- The most salient division between tool and tasks usageis between those who mostly use Excel, SQL, and a smallnumber of closed source toolsand those who use moreopen source tools and spend more time coding.
- R is used across this division: even people who dont codemuch or use many open source tools, use R.
- A secondary division emerges among the coding halfseparating a younger, Python-heavy data scientist/analystgroup, from a more experienced data scientist/engineercohort that tends to use a high number of tools and earnsthe highest salaries.
To see our complete model and input your own metrics topredict salary, see (but bewaretheres a transformationinvolved: dont forget to square the result!).
FOR THE FOURTH YEAR RUNNING, we at OReilly Mediahave collected survey data from data scientists, engineers, andothers in the data space, about their skills, tools, and salary.Across our four years of data, many key trends are more or lessconstant: median salaries, top tools, and correlations amongtool usage. For this years analysis, we collected responses fromSeptember 2015 to June 2016, from 983 data professionals.
In this report, we provide some different approaches to theanalysis, in particular conducting clustering on the respondents(not just tools). We have also adjusted the linear modelfor improved accuracy, using a square root transform andpublicly available data on geographical variation in economies.The survey itself also included new questions, most notablyabout specific data-related tasks and any change in salary.
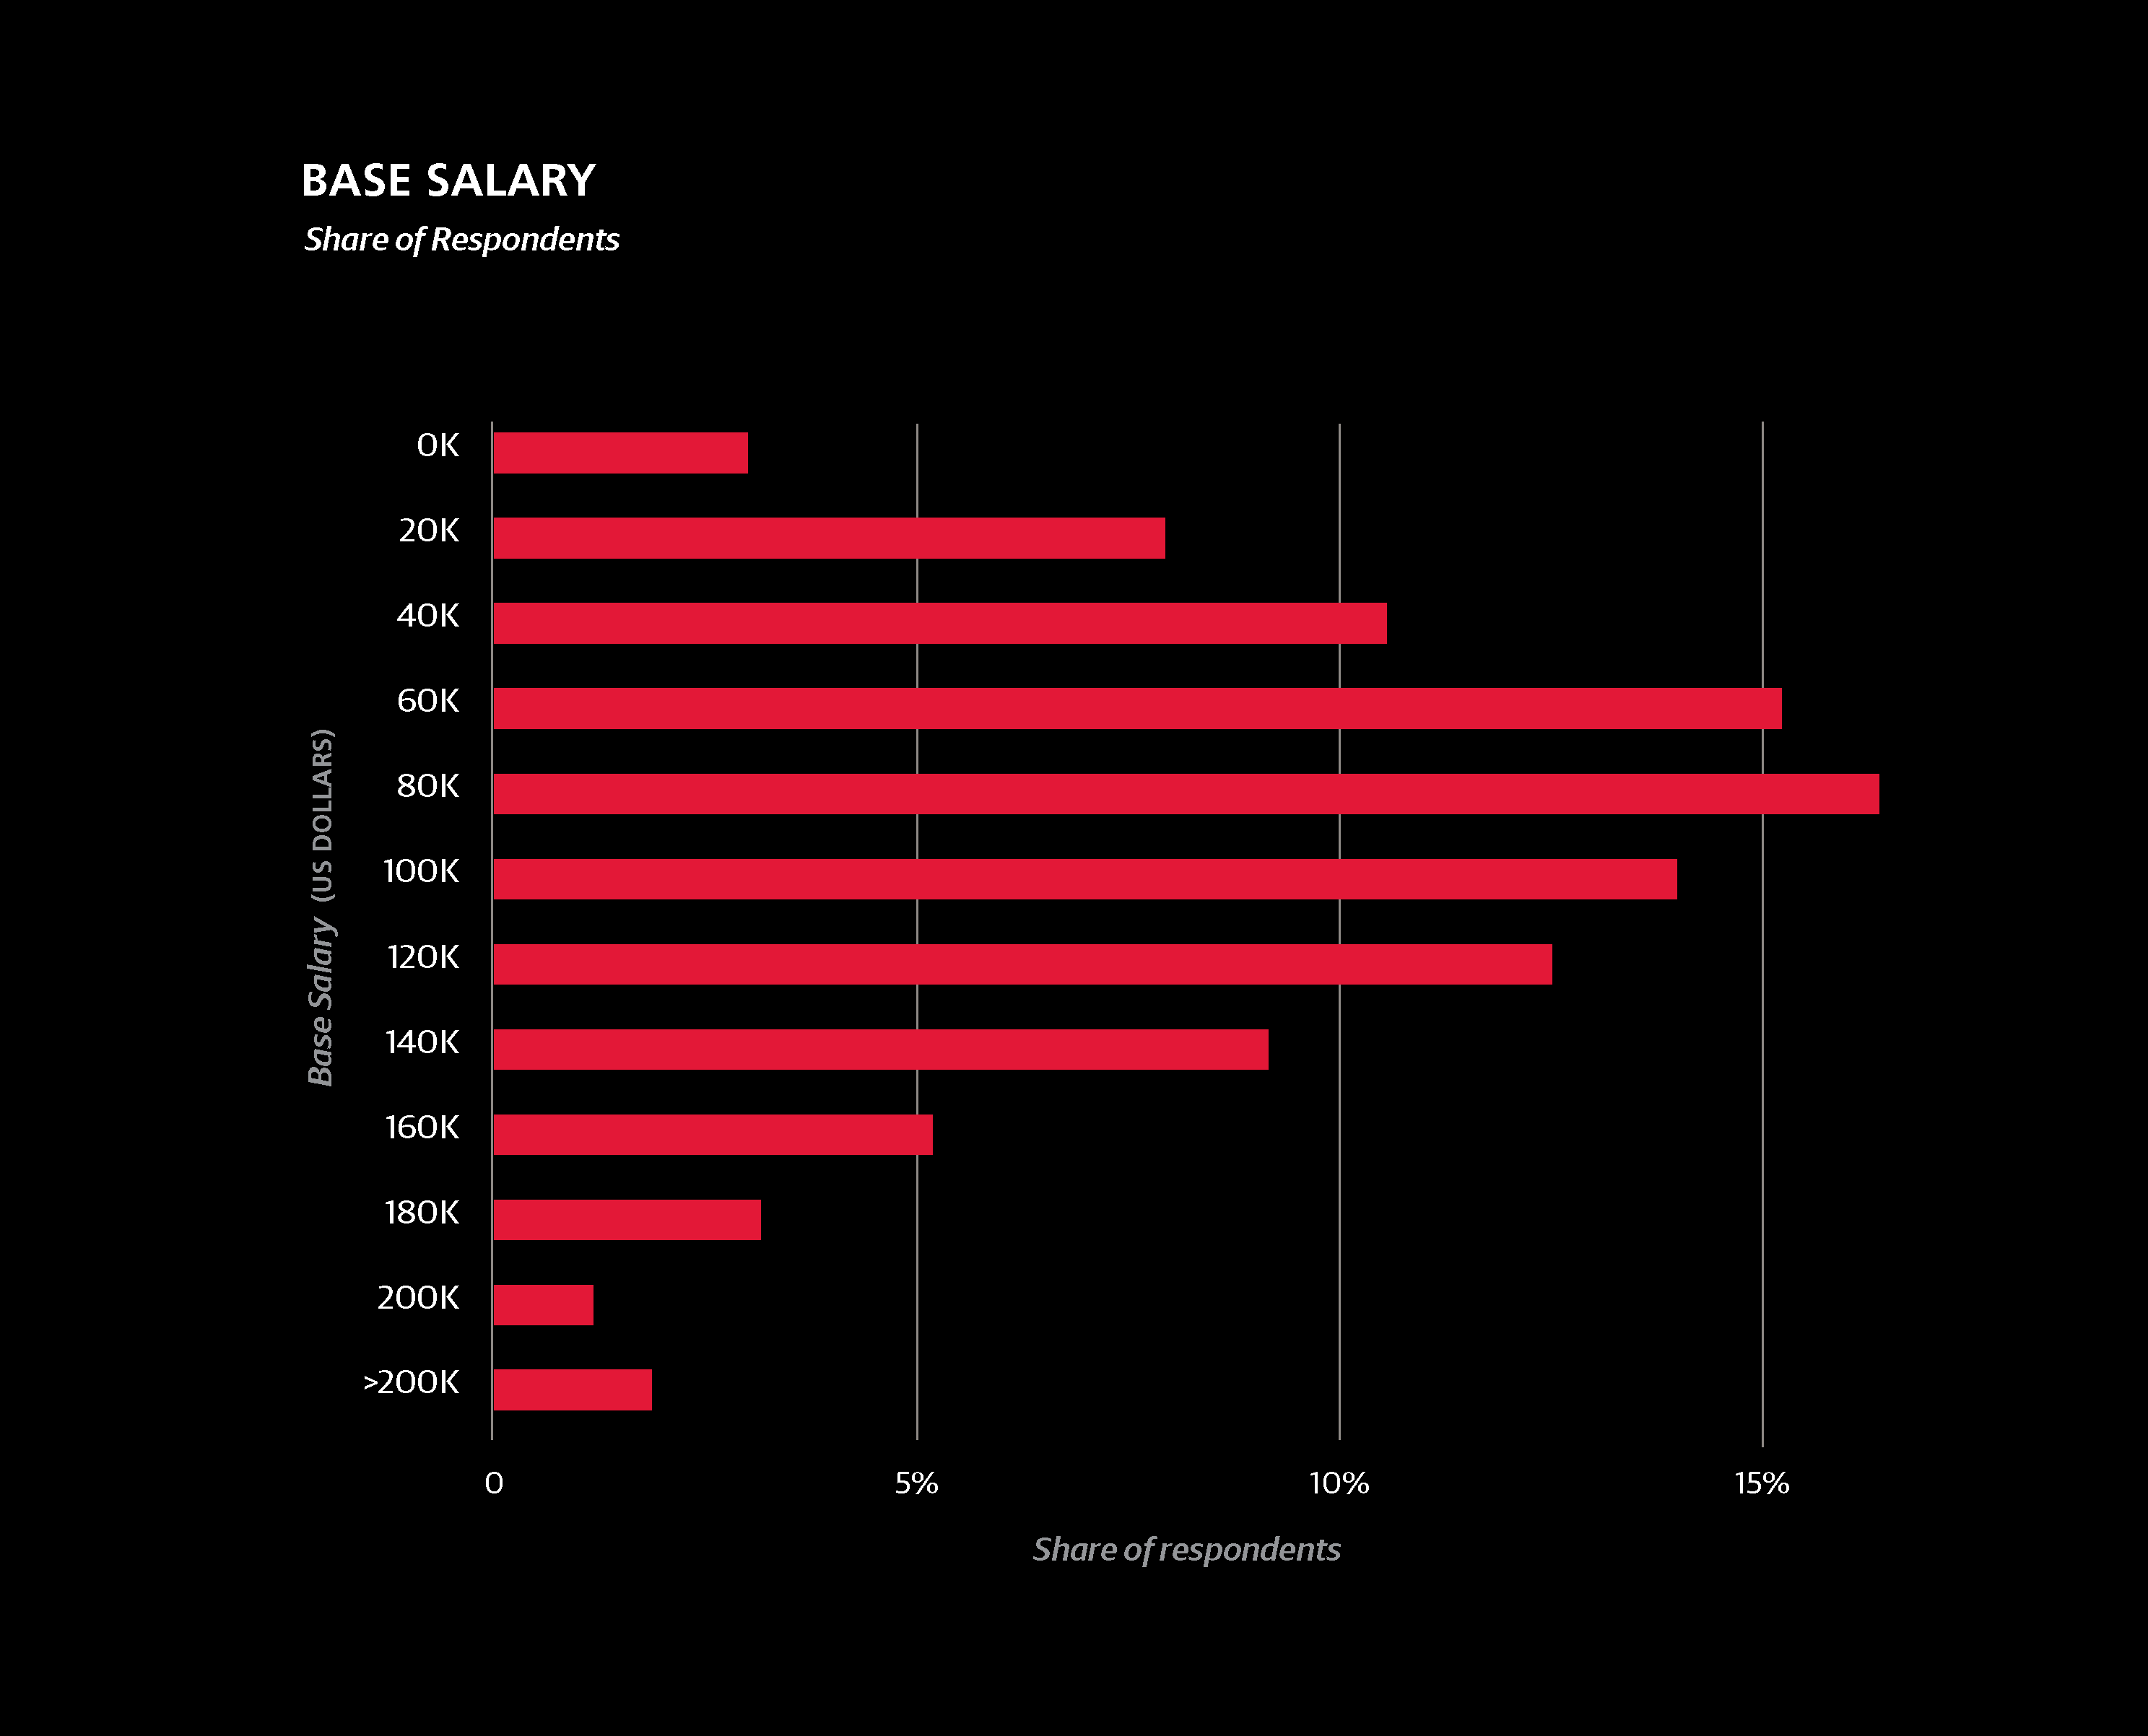
The median base salary of the entire sample was $87K. Thisfigure is slightly lower than in previous years (last year itwas $91K), but this discrepancy is fully attributable to shiftsin demographics: this years sample had a higher share of non-US respondents and respondents aged 30 or younger.Three-fifths of the sample came from the US, and theserespondents had a median salary of $106K.
For a number of survey questions, we show graphs of answershares and the median salaries of respondents who gaveparticular answers. While median salary is probably the bestnumber to compare how much two groups of people make, itdoesnt say anything about the spread or variation of salaries.In addition to median, we also show the interquartile range(IQR)two numbers that delineate salaries of the middle50%. This range is not a confidence interval, nor is it basedon standard deviations.
As an example, the IQR for US respondents was $80K to$138K, meaning one quarter of US respondents had salarieslower than $80K and one quarter had salaries higher than$138K. Perhaps more illustrative of the value of the IQR iscomparing the US Northeast and Midwest: the Northeast hasa higher median salary ($105K vs. $98K) but the third quartile cutoffs are $133K for the Northeast and $138K for the Midwest.This indicates that there is generally more variation inMidwest salaries, and that among top earnerssalaries mightbe even higher in the Midwest than in the Northeast.
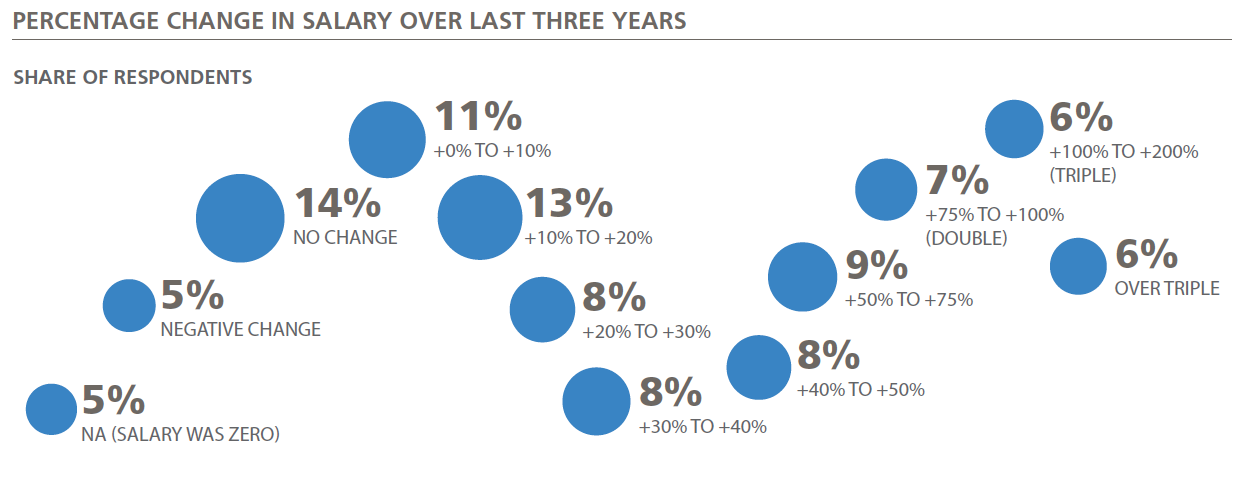
We also collected data on salary change over the last threeyears. About half of the sample reported a 20% change, andthe salary of 12% of the sample doubled. We attempted tomodel salary change with other variables from the survey,but the model performed much more poorly, with an R2of just 0.221. Many of the same significant features in thesalary regression model also appeared as factors in predictedsalary change: Spark/Unix, high meeting hours, high codinghours, and buildingprototype models, allpredict higher salarygrowth, while usingExcel, gender disparity,and working atan older companypredict lower salarygrowth. Geographyalso correlatedpositively with salarychange, meaning that
To use the model for you own salary, refer to the full model in, and add up the coefficients that apply to you.Once all of the constants are added, square the result for afinal salary estimate (note: the coefficients are not in dollars).The contribution of a particular coefficient to the eventualsalary estimate depends on the other coefficients: the higherthe salary, the higher the contribution of each coefficient.
For example, the salary difference between a junior data scientistand a senior architect will be greater in a country withhigh salaries than somewhere with lower salaries.
Font size:
Interval:
Bookmark:
Similar books «2016 Data Science Salary Survey»
Look at similar books to 2016 Data Science Salary Survey. We have selected literature similar in name and meaning in the hope of providing readers with more options to find new, interesting, not yet read works.
Discussion, reviews of the book 2016 Data Science Salary Survey and just readers' own opinions. Leave your comments, write what you think about the work, its meaning or the main characters. Specify what exactly you liked and what you didn't like, and why you think so.