Roger Magoulas - 2016 design salary survey : tools, trends, titles, what pays (and what doesnt) for design professionals
Here you can read online Roger Magoulas - 2016 design salary survey : tools, trends, titles, what pays (and what doesnt) for design professionals full text of the book (entire story) in english for free. Download pdf and epub, get meaning, cover and reviews about this ebook. City: Sebastopol, CA, year: 2016, publisher: OReilly Media, Inc., genre: Politics. Description of the work, (preface) as well as reviews are available. Best literature library LitArk.com created for fans of good reading and offers a wide selection of genres:
Romance novel
Science fiction
Adventure
Detective
Science
History
Home and family
Prose
Art
Politics
Computer
Non-fiction
Religion
Business
Children
Humor
Choose a favorite category and find really read worthwhile books. Enjoy immersion in the world of imagination, feel the emotions of the characters or learn something new for yourself, make an fascinating discovery.
- Book:2016 design salary survey : tools, trends, titles, what pays (and what doesnt) for design professionals
- Author:
- Publisher:OReilly Media, Inc.
- Genre:
- Year:2016
- City:Sebastopol, CA
- Rating:4 / 5
- Favourites:Add to favourites
- Your mark:
2016 design salary survey : tools, trends, titles, what pays (and what doesnt) for design professionals: summary, description and annotation
We offer to read an annotation, description, summary or preface (depends on what the author of the book "2016 design salary survey : tools, trends, titles, what pays (and what doesnt) for design professionals" wrote himself). If you haven't found the necessary information about the book — write in the comments, we will try to find it.
This past autumn, OReilly Media for the first time conducted an anonymous online survey of salaries of designers, UX/UI specialists, and others in the design space. This in-depth report presents complete survey results which demonstrate how variables such as job title, location, use of specific tools, and the types of tasks performed affect salary and other compensation. The survey attracted more than 300 designers, managers, and directors from 25 countries. Most of them work onweb and mobile products or connected devices in a wide variety of industries.
Respondents median salaries have been sorted according to:
- Work location (country or US region), age, gender, and education
- Job title, such as director, manager, consultant, developer, analyst, and designer
- Company size, products and services produced, team size, and design processes used
- Professionals they work with most, including programmers, other designers, and product managers
- A range of tasks, including user research, usability testing, information architecture, UI design, prototyping, and project management
- Tools used most often, from Dropbox, Slack, and GitHub to Adobe Illustrator, Sketch, and InVision, to Google Analytics and HTML/CSS
Curious how you would do in a different location, or how different skills and responsibilities might affect your salary? Download this free report to gain insight from these potentially career-changing findings, and learn how to plug your own information into the surveys linear model.
To stay up to date on this research, your participation is critical. The survey is now open for the 2017 report, and if you can spare just 10 minutes of your time, we encourage you to go to http://www.oreilly.com/design/2017-design-salary-survey.html.
Roger Magoulas: author's other books
Who wrote 2016 design salary survey : tools, trends, titles, what pays (and what doesnt) for design professionals? Find out the surname, the name of the author of the book and a list of all author's works by series.


2016 design salary survey : tools, trends, titles, what pays (and what doesnt) for design professionals — read online for free the complete book (whole text) full work
Below is the text of the book, divided by pages. System saving the place of the last page read, allows you to conveniently read the book "2016 design salary survey : tools, trends, titles, what pays (and what doesnt) for design professionals" online for free, without having to search again every time where you left off. Put a bookmark, and you can go to the page where you finished reading at any time.
Font size:
Interval:
Bookmark:
THE 2016 DESIGN SALARY SURVEY investigates the tools, tasks, and compensation of designers, UX specialists, and others in the design space based on data collected in an online, anonymous survey. The 324 respondents largely worked in the design of web/mobile products or connected devices, and came from a wide variety of industries and backgrounds. We paid special attention to the software designers userespondents were asked which of more than 100 tools they useand usage correlations between them.
Key findings include:
- UX designers earn a median salary of $91K ($99K for US-basedrespondents)
- California respondents report the highest wages
- Age doesnt predict salary, years of experience do
- Women are paid less than meneven when all other variables match
- Most UX designers tend to use one of two software stacks: one anchored by Adobe Illustrator, the other anchored by Sketch
- Those who code (even just a little) earn more
- When respondents provide tool and task information, job title becomes less useful for predicting salaries
In a rather manual, low-tech way, this report is interactive: just plugyour own data into the linear regression model to get a salary prediction(no buttons, just do the math). You can press actual buttons, and earnour sincere gratitude, by taking the surveyit only takes about 5 to 10 minutes and is crucial for us to continue providing this kind of research: oreilly.com/design/2017-design-salary-survey.
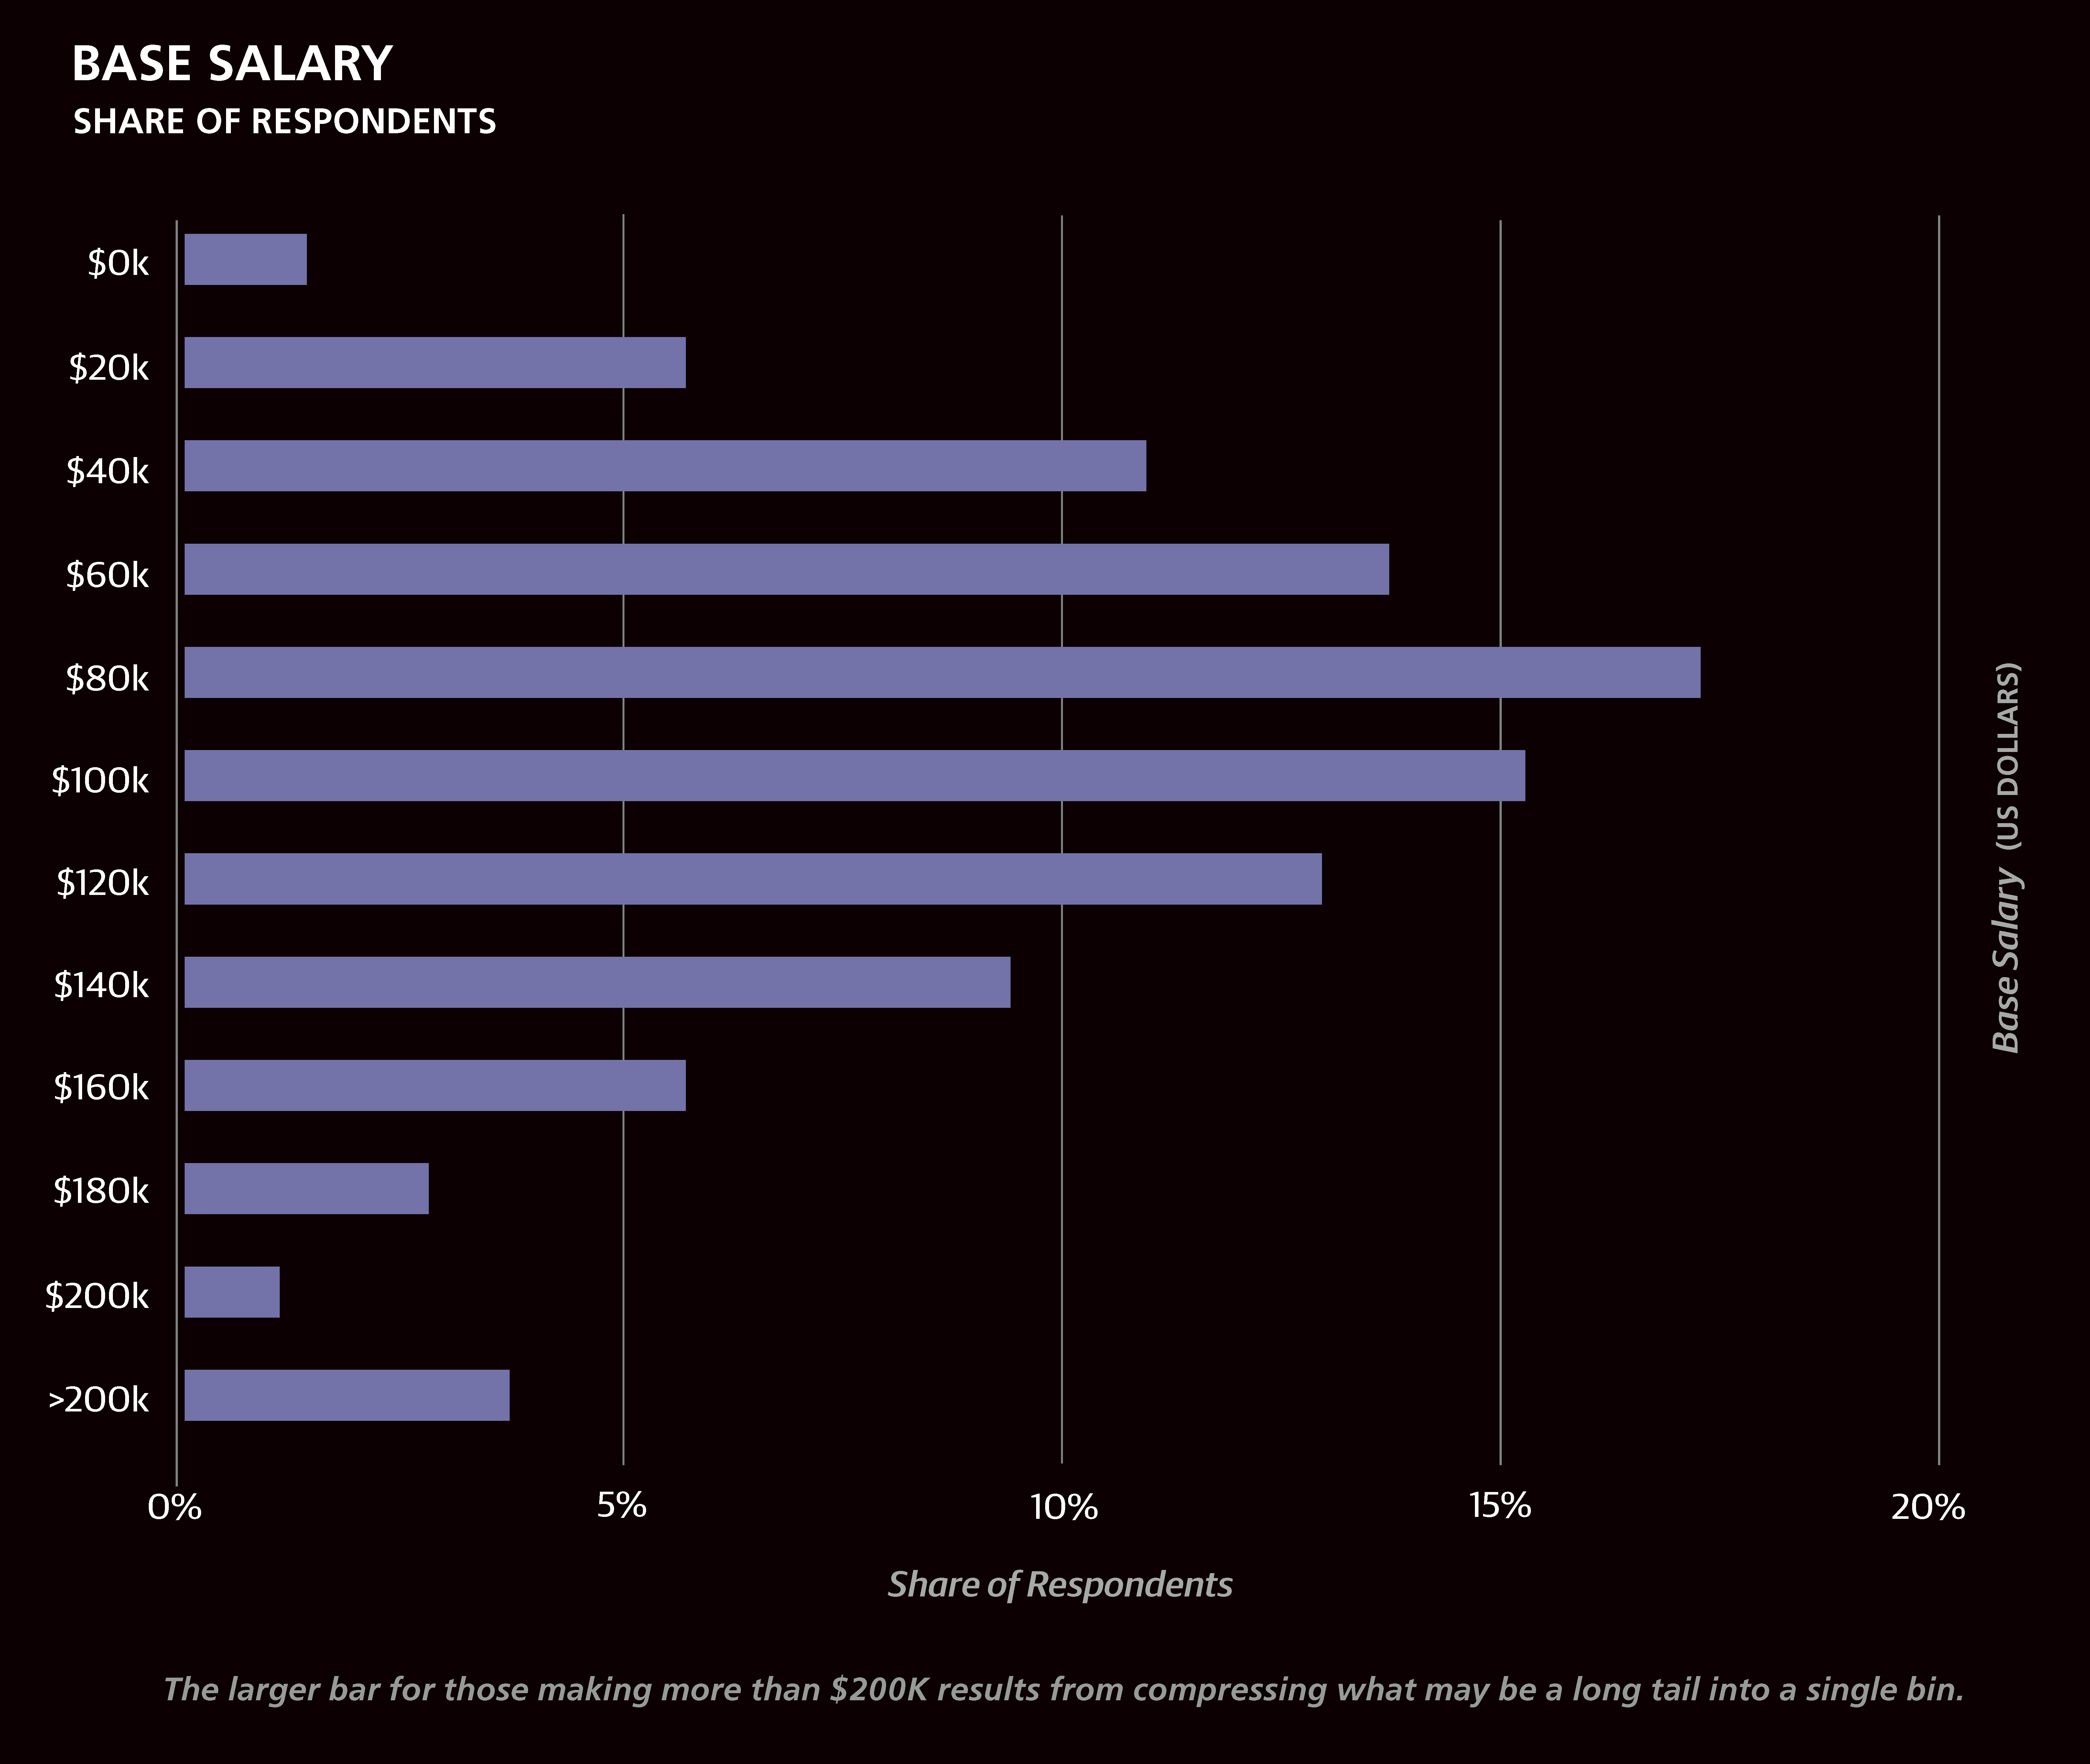
IN THE FALL OF 2015, OReilly Media made a comprehensive online survey available, focused on designers, their work, and compensation. The 324 designers, UX specialists, engineers, managers, and directors who took the survey came from 25 countries and 34 US states. We calculated the median salary of the survey respondents as $91,000 USD, a figure we decompose using information from other survey questions covering demographics, tool usage, and participation in several design-related tasks. While we can compare the salaries of groups of respondents based on how they answered particular questionsfor example, those who use a particular tool and those who do nota more rigorous way of assessing salary differences is through a linear model, which allows us to see how salary corresponds to a variable holding all others constant. In this report, we present both methods. The reader should keep in mind that any associations or correlations presented may not be causative, and that the self-selecting nature of the survey respondents means there is no guarantee the sample is representative of professionals in the design space. That said, we have taken care to be cautious in our conclusions to only present results that are statistically significant under usual assumptions that the sample is sufficiently close to random. Even those designers who know the space well will likely find something here that is new.
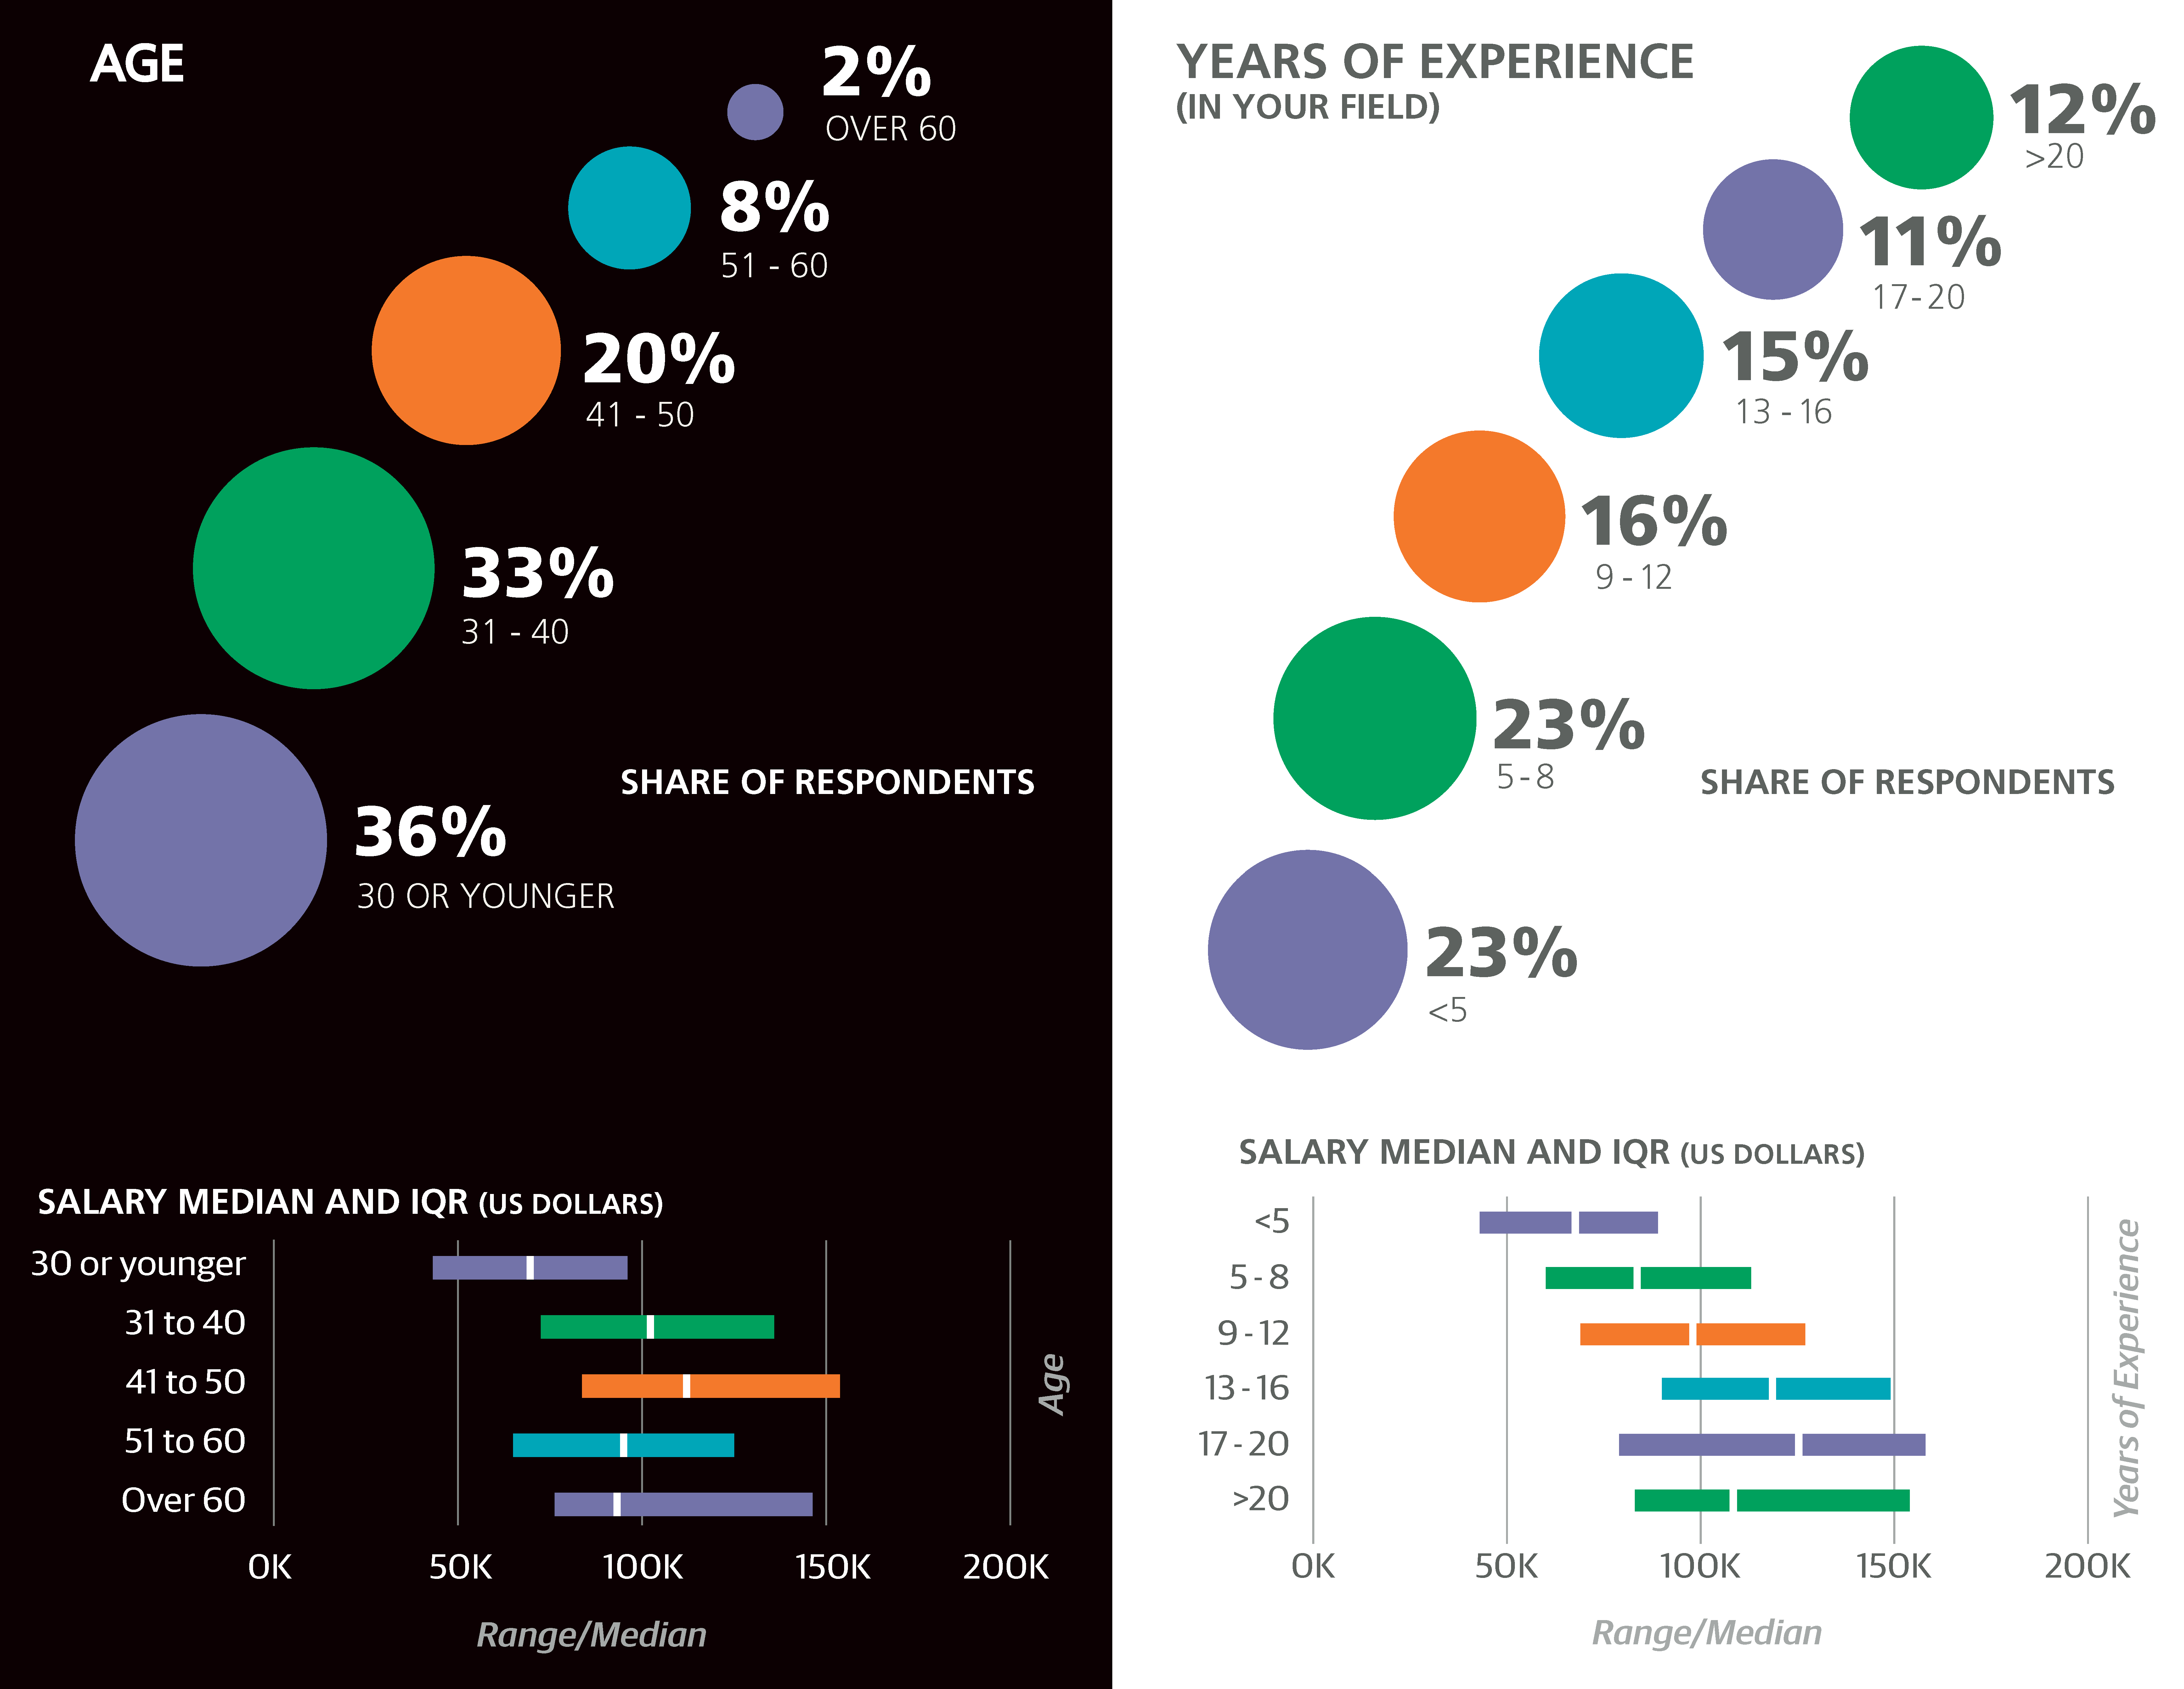
In the horizontal bar charts throughout this report, we include the interquartile range (IQR) to show the middle 50% of respondents answers to questions such as salary. One quarter of the respondents has a salary below the displayed range, and one quarter has a salary above the displayed range.
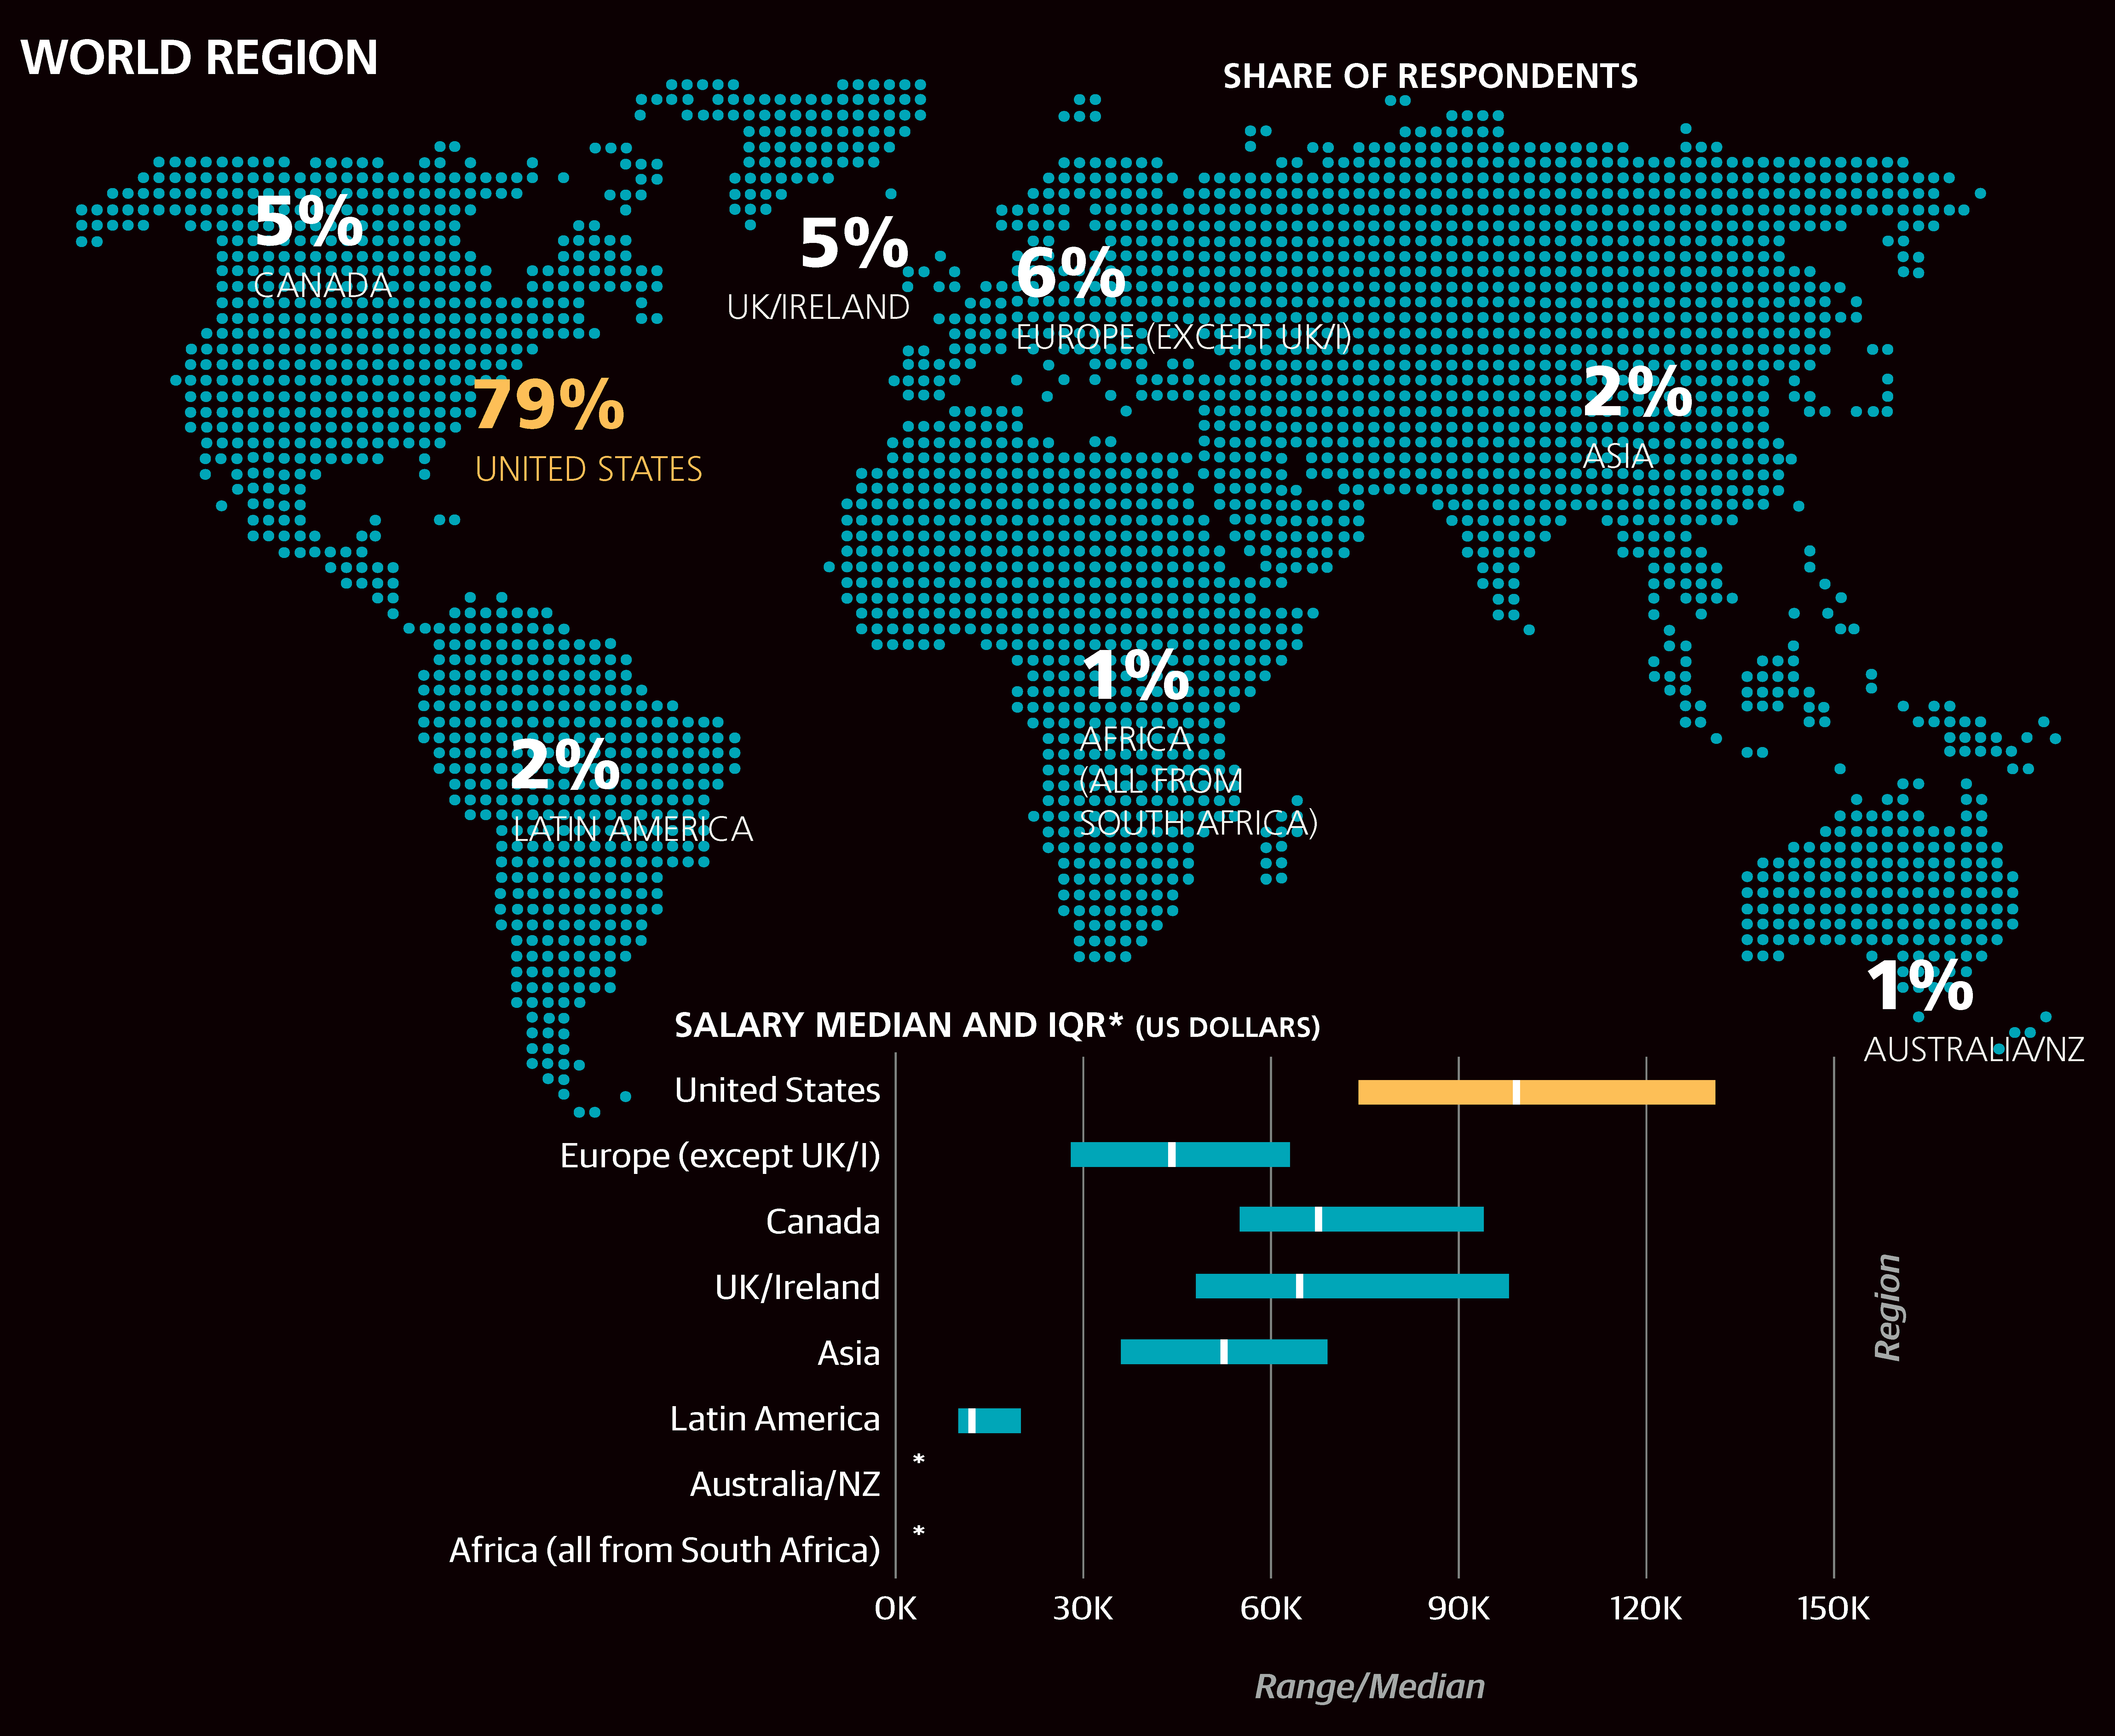
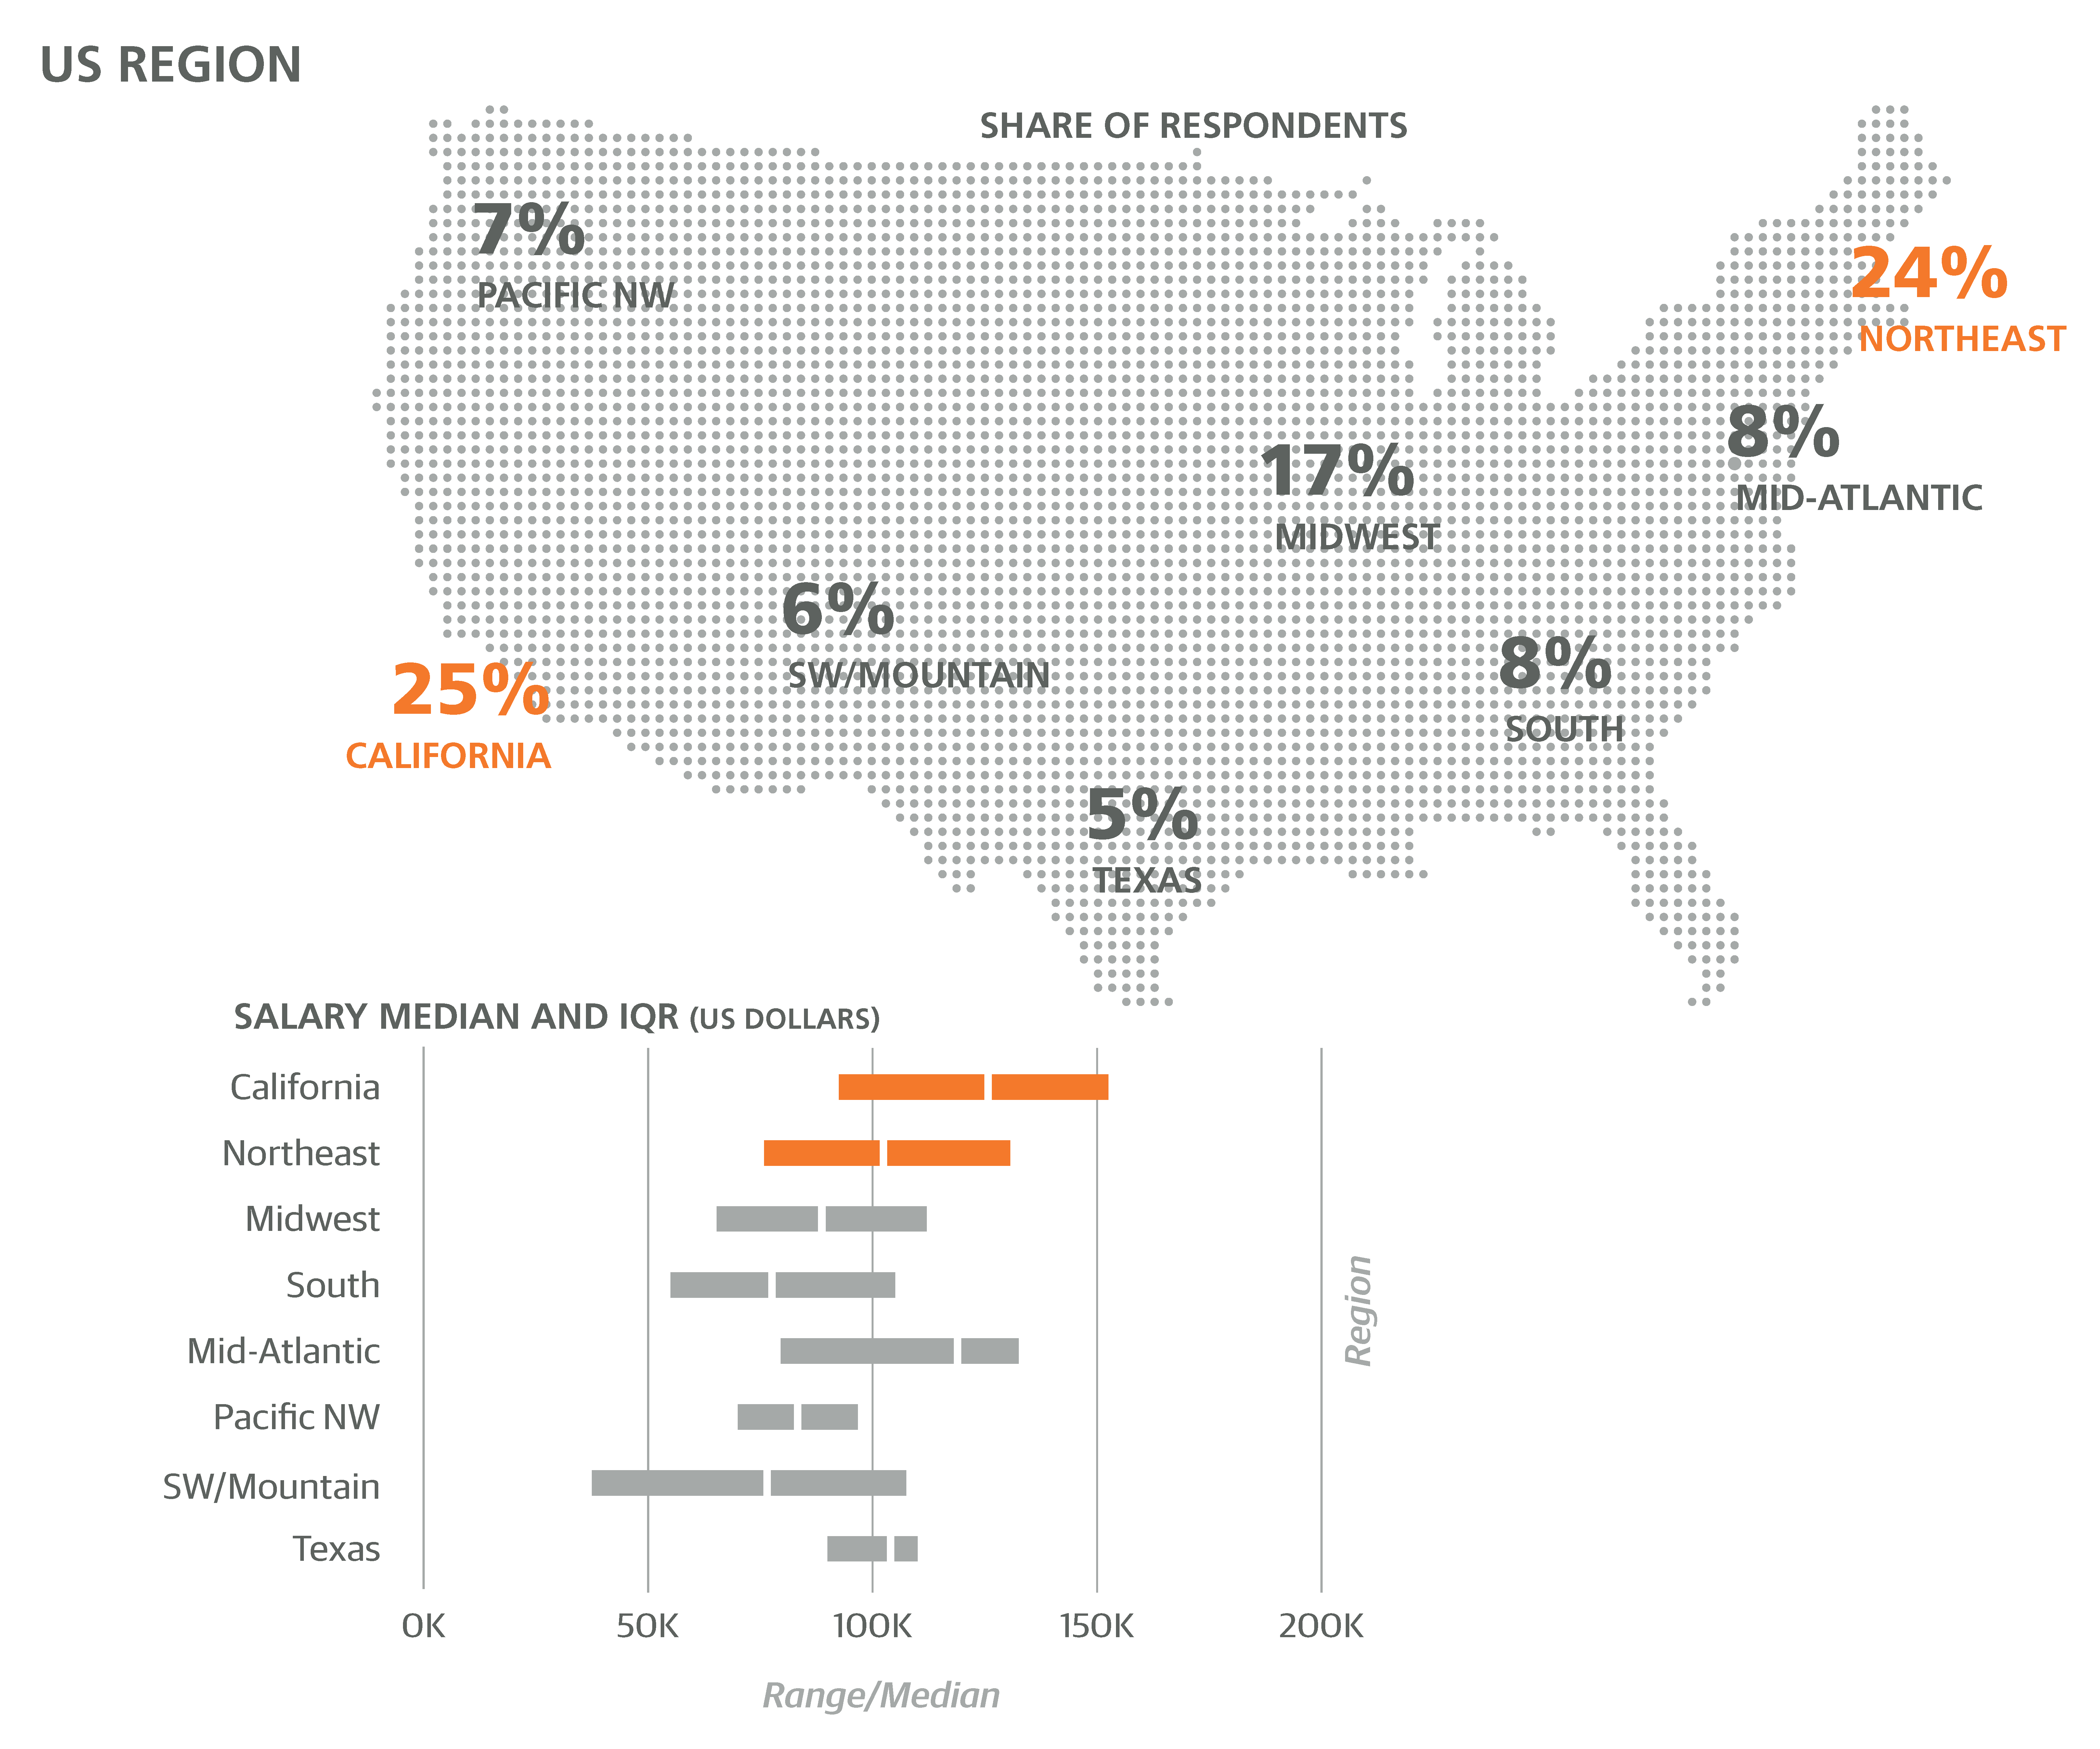
THE FIRST THING TO DO WITH SURVEY DATA is to get to know the sample. Most respondents (79%) work in the US with most of the rest working in Europe (11%) and Canada (5%). Half of the US respondents came from California and the Northeast (by way of comparison, these two regions make up about a quarter of the US population). We note two possible causes for bias towards California and the Northeast: people living in those regions disproportionately respond to OReilly surveys and those regions may have more design jobs. The discrepancy between the median salaries of US ($99K) and European respondents ($48K) is greater than what would be expected given national per capita income, but this is partially explained by more US respondents holding higher positionsa quirk of the sample. The US region with the highest salary was California (with median salary of $128K), followed by the Mid-Atlantic ($118K).
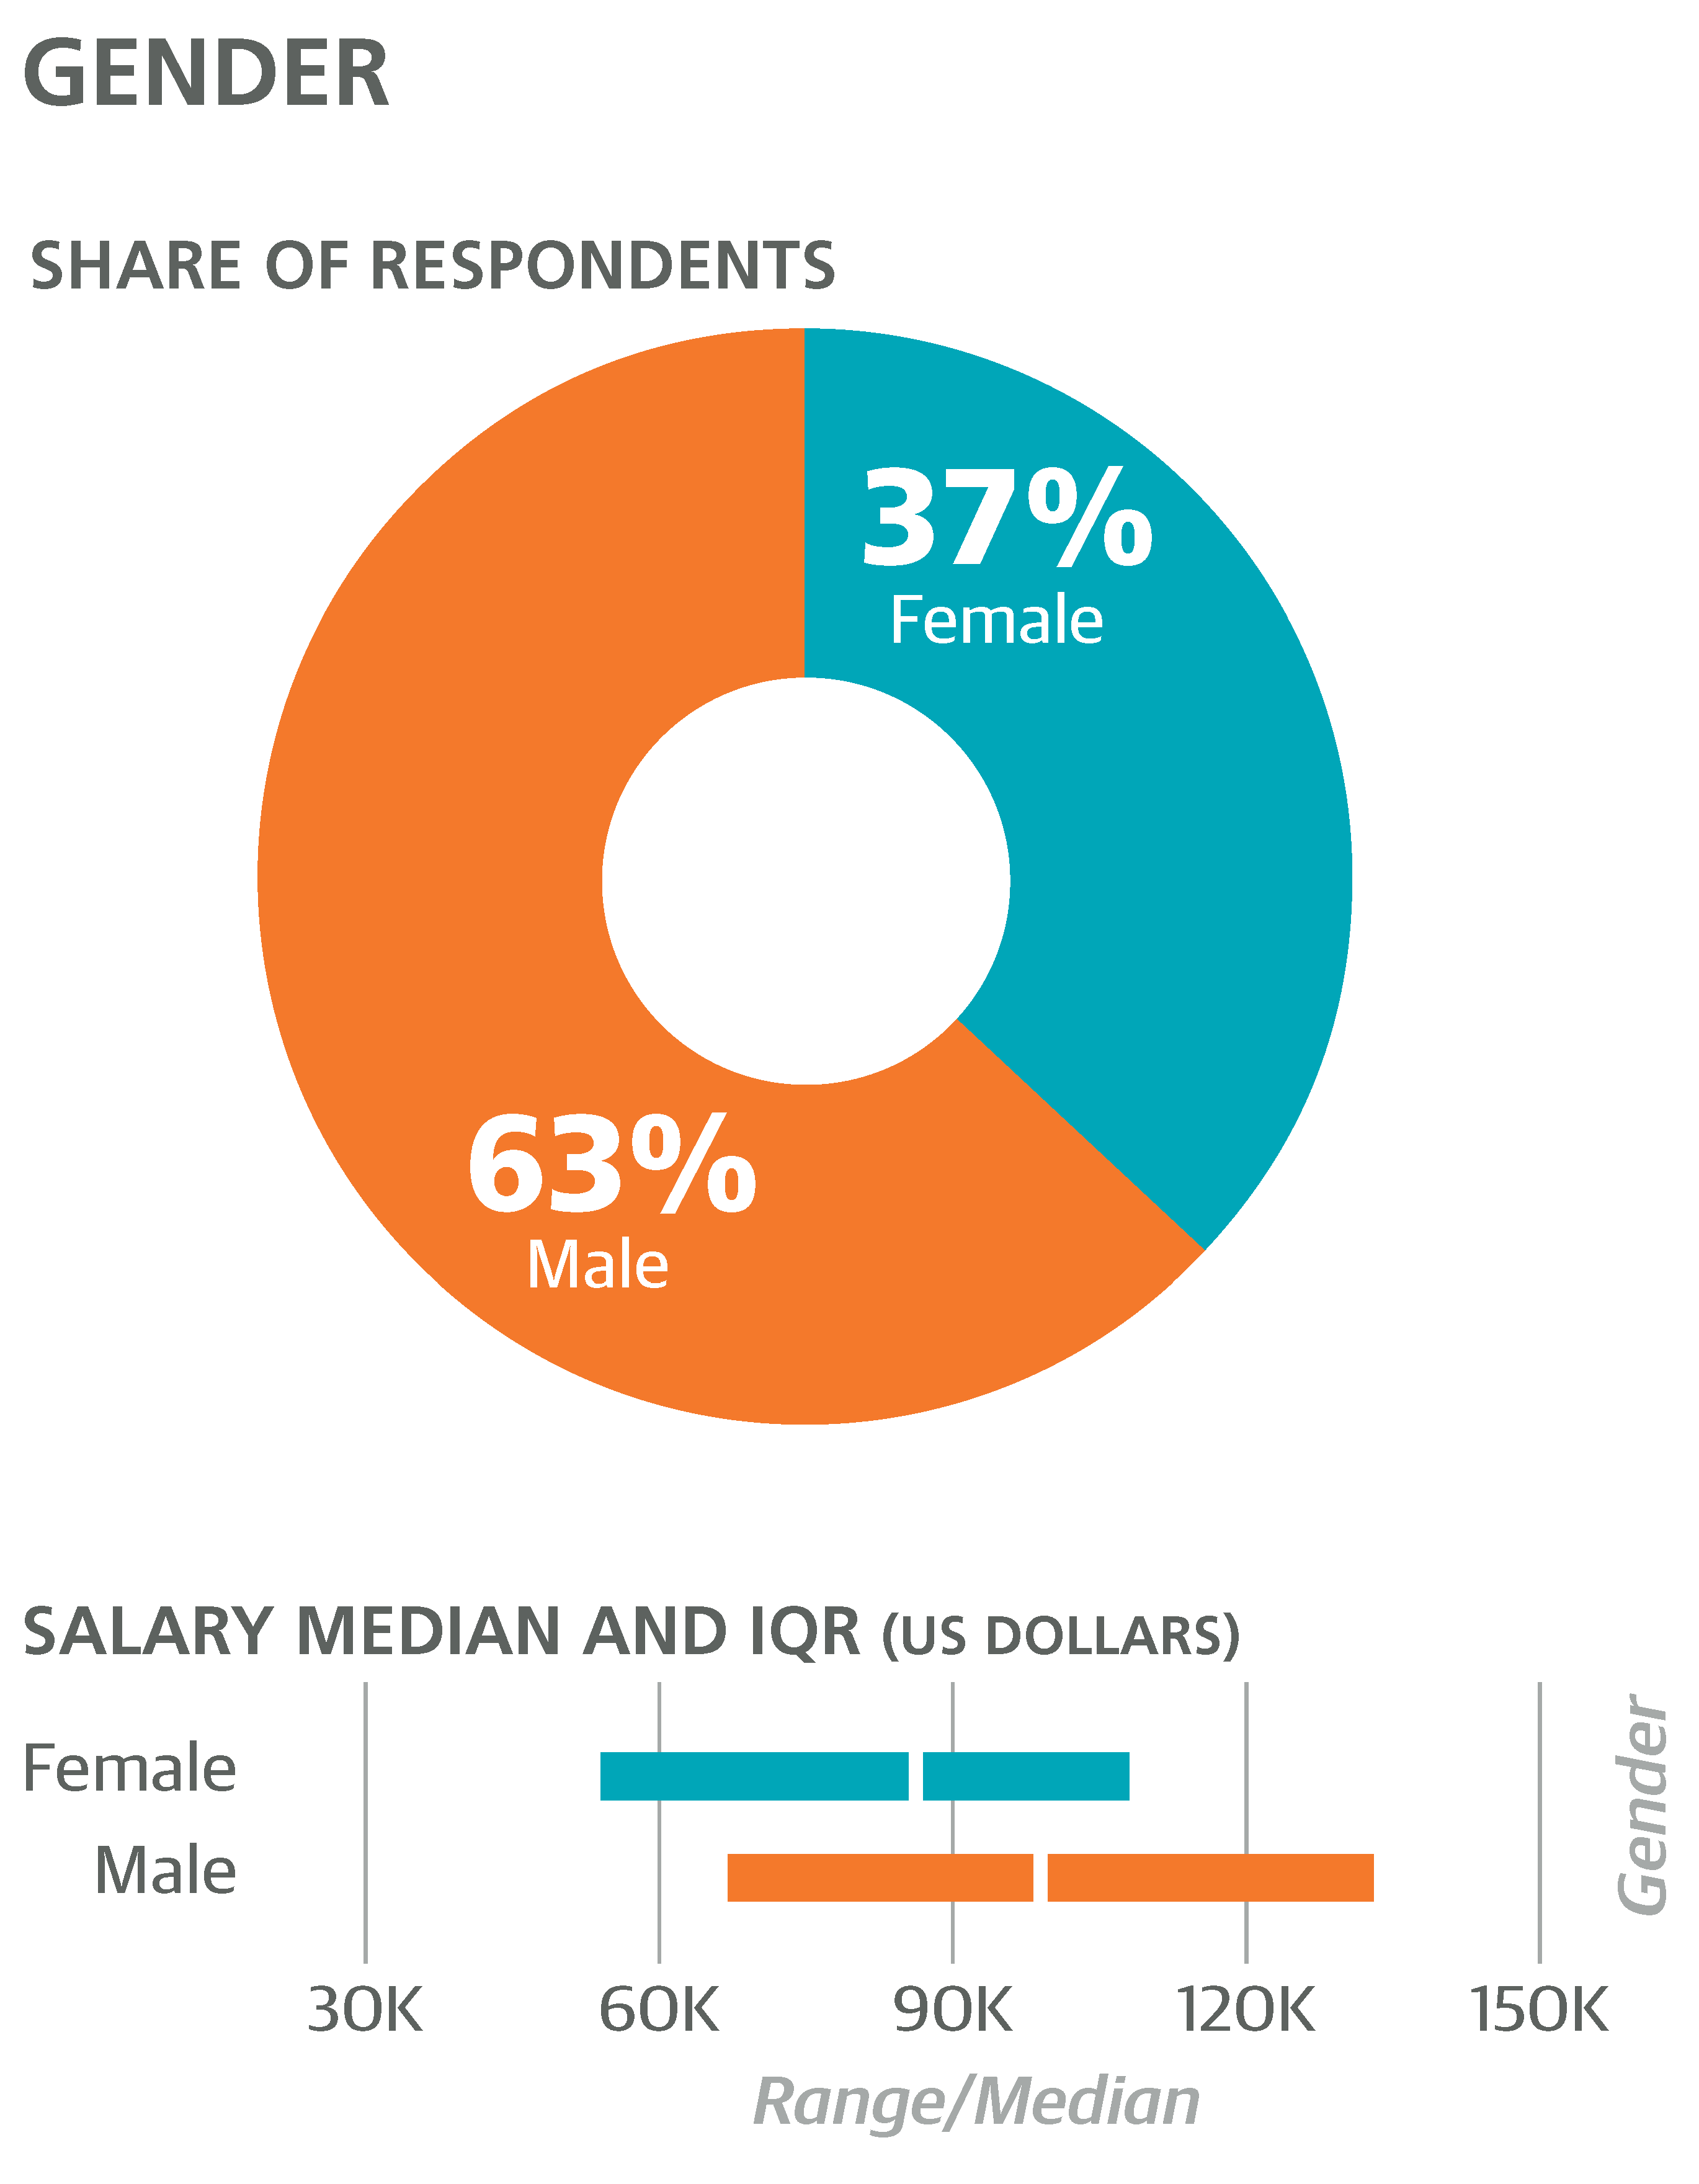
Two-thirds of the respondents were male, and a significant gap in median pay between male and female respondents was present ($99K and $85K, respectively). About half of the $14K difference in the sample is attributable to the fact that a larger share of the samples men held higher positions. Still, the $6K coefficient for female in the linear model indicates that even when every other variable is held constant (same work, same skills) women earn about $6K less than men. This is roughly the same gender gap that we saw for data scientists in a different salary survey (depending on which model was used, $3K to $8K).
More than a third of the respondents were 30 years old or younger, and predictably this group had a lower median salary than the rest ($71K). However, the age groups with the highest salaries in the sample were from 36 to 50 ($116K), higher than the over-50 segment ($94K). This is partly explained (but only partly) by the different positions held by the respondents aged 36 to 50; for example, the share of directors in the 36 to 50 group was greater than in the over-50 group. About half of the respondents had at least 10 years of experience in their role, and earned a median salary of $114K, while the less-experienced half earned a median of $74K.
As for education, 4% had a doctorate degree and 29% had a masters degree (but no PhD). While respondents with a PhD did have a higher median salary than average ($115K, though this is a fairly small sample), respondents with only a masters did not have a significantly higher salary than those without one. Another significant pattern was that the 38% of respondents whose academic background was in graphic design reported a median salary of $81Ksignificantly less than those who had a different academic background (median $96K). In contrast, respondents with an academic background in mathematics, statistics, or physics earned much more than the rest of the sample (median $120K). Like the PhD figure, this is based on a small cohortjust 10 respondents but it is worth noting that the titles of these respondents did not stand out from the rest: they were, for the most part, UX and Designer.
JOB TITLE WAS COLLECTED AS AN OPEN-TEXT FIELD, and respondents entered 183 unique titles. Many of the titles are clearly just variations on the same type of role, but perhaps more accurately, they are points on a continuum: Software Designer & Consultant, UX Consultant, UXResearcher, Design Research Associate, Visual Interaction Designer, Senior Mobile Interaction Designer, UI Developer, Web Developer, Front End Developer, Software Developer, Programmer. Even this small list of titles could be binned in multiple ways.Our strategy here is to assign a titlebased on the first keyword it includesfrom a sequence: Director, Manager, Architect, Consultant, Engineer/Developer (or Programmer), Researcher, Analyst, Graphic Designer, UI/UX, UX (or Experience), UI (or Interaction), Designer, Other. So, UX Director becomes Director andDesigner Consultant becomes Consultant.
Font size:
Interval:
Bookmark:
Similar books «2016 design salary survey : tools, trends, titles, what pays (and what doesnt) for design professionals»
Look at similar books to 2016 design salary survey : tools, trends, titles, what pays (and what doesnt) for design professionals. We have selected literature similar in name and meaning in the hope of providing readers with more options to find new, interesting, not yet read works.
Discussion, reviews of the book 2016 design salary survey : tools, trends, titles, what pays (and what doesnt) for design professionals and just readers' own opinions. Leave your comments, write what you think about the work, its meaning or the main characters. Specify what exactly you liked and what you didn't like, and why you think so.