John King - 2016 Software Development Salary Survey
Here you can read online John King - 2016 Software Development Salary Survey full text of the book (entire story) in english for free. Download pdf and epub, get meaning, cover and reviews about this ebook. year: 2016, publisher: OReilly Media, Inc., genre: Politics. Description of the work, (preface) as well as reviews are available. Best literature library LitArk.com created for fans of good reading and offers a wide selection of genres:
Romance novel
Science fiction
Adventure
Detective
Science
History
Home and family
Prose
Art
Politics
Computer
Non-fiction
Religion
Business
Children
Humor
Choose a favorite category and find really read worthwhile books. Enjoy immersion in the world of imagination, feel the emotions of the characters or learn something new for yourself, make an fascinating discovery.

2016 Software Development Salary Survey: summary, description and annotation
We offer to read an annotation, description, summary or preface (depends on what the author of the book "2016 Software Development Salary Survey" wrote himself). If you haven't found the necessary information about the book — write in the comments, we will try to find it.
Abstract: Early this year, more than 5000 software engineers, developers, and other programming professionals participated in OReilly Medias first Software Development Salary Survey. Participants included professionals from large and small companies in a variety of industries across 51 countries and all 50 US states. With the complete survey results in this in-depth report, youll be able to explore the world of software development-and the careers that propel it-in great detail. With this report, youll learn: The top programming languages that respondents currently use professionally Where programmers make the highest salaries-by country and by regions in the US Salary ranges by industry and by specific programming language The difference in earnings between programmers who work on tiny teams vs those work on larger teams The most common programming languages that respondents no longer use in their work The most common languages that respondents intend to learn within the next couple of years Pick up a copy of this report and find out where you stand in the programming world. We encourage you to plug in your own data points to our survey model to see how you compare to other programming professionals in your industry
John King: author's other books
Who wrote 2016 Software Development Salary Survey? Find out the surname, the name of the author of the book and a list of all author's works by series.


2016 Software Development Salary Survey — read online for free the complete book (whole text) full work
Below is the text of the book, divided by pages. System saving the place of the last page read, allows you to conveniently read the book "2016 Software Development Salary Survey" online for free, without having to search again every time where you left off. Put a bookmark, and you can go to the page where you finished reading at any time.
Font size:
Interval:
Bookmark:
by John King and Roger Magoulas
Copyright 2016 OReilly Media. All rights reserved.
Printed in Canada.
Published by OReilly Media, Inc. , 1005 Gravenstein Highway North, Sebastopol, CA 95472.
OReilly books may be purchased for educational, business, or sales promotional use. Online editions are also available for most titles (http://oreilly.com/safari). For more information, contact our corporate/institutional sales department: 800-998-9938 or corporate@oreilly.com .
- Editors: Dawn Schanafelt, Susan Conant
- Production Manager: Dan Fauxsmith
- Designer: Ellie Volckhausen
- Cover Designer: Karen Montgomery
- April 2016: First Edition
- 2016-04-18: First Release
The OReilly logo is a registered trademark of OReilly Media, Inc. 2016 Software Development Salary Survey, the cover image, and related trade dress are trademarks of OReilly Media, Inc.
While the publisher and the authors have used good faith efforts to ensure that the information and instructions contained in this work are accurate, the publisher and the authors disclaim all responsibility for errors or omissions, including without limitation responsibility for damages resulting from the use of or reliance on this work. Use of the information and instructions contained in this work is at your own risk. If any code samples or other technology this work contains or describes is subject to open source licenses or the intellectual property rights of others, it is your responsibility to ensure that your use thereof complies with such licenses and/or rights.
978-1-491-95950-3
[TI]
The OReilly Software Development Salary Survey contained 72 questions about the respondents roles, tools, compensation, and demographic background. Over 5,000 software engineers, developers, and other professionals involved in programming participated in the survey, providing us with the opportunity to explore the software-development worldand the careers that propel itin great detail. Key findings include:
- Top languages currently used professionally in the sample: JavaScript, HTML, CSS, Java, Bash, Python
- Respondents reported using an average of 3.75 languages
- The highest salaries are in the US (especially CA, OR, WA), Switzerland, Japan, Australia, and the UK
- Software development is a social endeavor: those on tiny teams and who dont attend meetings tend to earn much less
- The most common languages that respondents used in the past but no longer use were C/C++, Java, PHP
- The most common languages that respondents stated they intend to learn in the next 12 years were Go, Swift, Python, and Scala
Salary estimates can be obtained from a model based on the survey data whose coefficients are mentioned throughout the report and repeated in full at the end. We hope you will learn something new (and useful!) from this report, and we encourage you to try plugging your own data points into the model.
You can take next years survey here.
The first OReilly Software Development Salary Survey was conducted online using Google Forms. Between January and February 2016, 5,081 respondents submitted responses, from 51 countries and all 50 US states, from companies both large and small, and from a wide variety of industries. Respondents were mostly software developers, but other professionals who program also participated.
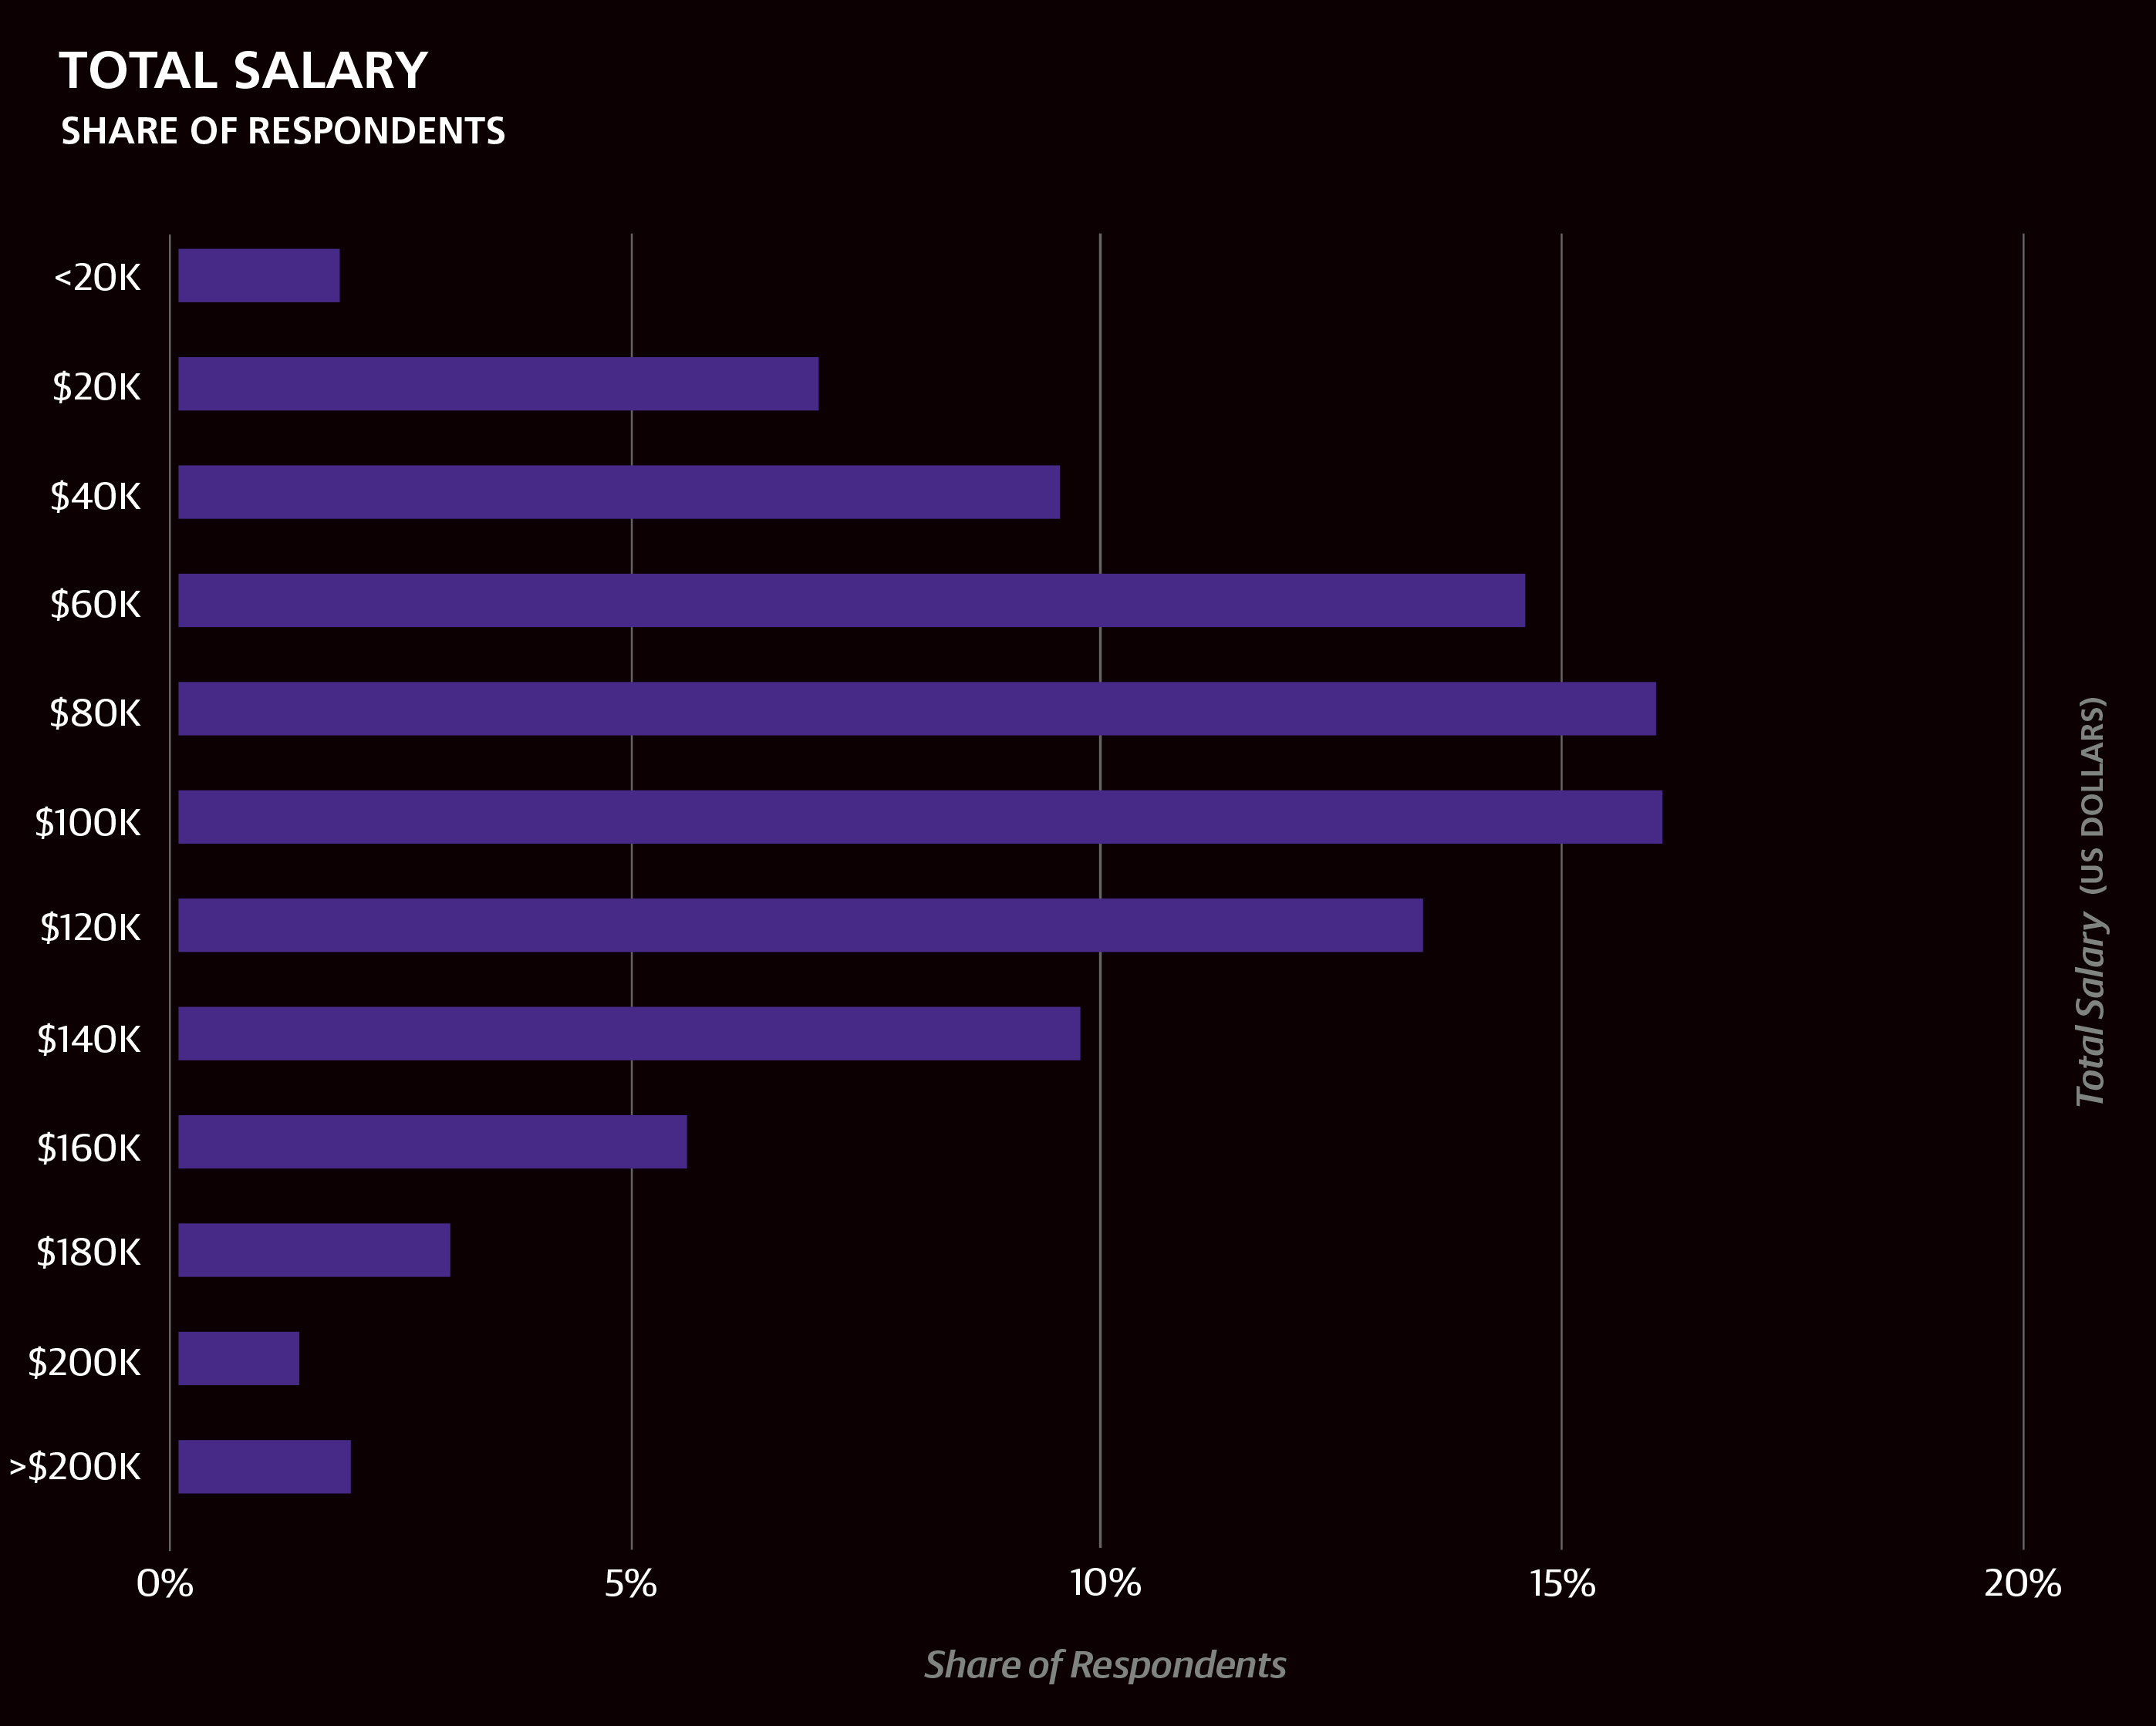
The median salary of the entire sample was $90,000 ($110,000 for US respondents only), with the middle half of all respondents earning between $60K and $125K. (The latter statistic is called the interquartile range (IQR)the middle 50%and is used to describe the salaries of particular subsets of the sample in the text below and in the accompanying graphs. The IQR is useful for showing the middle of the salary range without the distortion of outliers in the lowest and highest quartiles). Much of the variation in salary can be described using other variables gathered via the survey.
In addition to simply reporting the salaries of specific groups of respondents, such as those from a certain industry or who use a certain language, we also present coefficients corresponding to these groups from a simple, linear model based on the survey data. The coefficients are contribution components: by summing the coefficients corresponding to variables that apply to someone working in software development, we obtain an estimate for their salary. Note that not all variables get included in the model, since the method used to generate the model penalizes complexity to avoid overfitting and thus deems many variables insignificant. In each section we mention the relevant, significant coefficients, and at the end of the report we repeat those coefficients when we show the full model.
In the horizontal bar charts throughout this report, we include the interquartile range (IQR) to show the middle 50% of respondents answers to questions such as salary. One quarter of the respondents has a salary below the displayed range, and one quarter has a salary above the displayed range.
A primary motivation for constructing a linear model is to clarify the relationship between salary and demographic/role-related variables when two variables are highly correlated. For example, Asian respondents tend to have less experience than other groups and also have a low median salary: $31K, about $80K less than US-based respondents. However, the model isolates the effects of the different variableswhen the model takes experience into account, the discrepancy between US and Asia salaries is halved.
We deliberately highlight effects with quotation marks to highlight a key point to keep in mind when interpreting these results: correlation does not imply causation. A classic example involves meetings: just because salary clearly rises with the weekly number of hours spent in meetings, dont expect to get a raise just by maneuvering to add meetings to your schedule! Keep in mind that the survey methodology does not support what may, intuitively, seem like reasonable assumptions of causation from even the strongest correlationstesting for causation is a difficult process at best.
We excluded managers and students from the model altogether as many of the features we think might help determine salary, such as language use, likely work differently, if at all, with these groups. We also exclude those working fewer than 30 hours per week.
One of the most basic pieces of information that has a strong effect on salary is geography. Most respondents were based in the US (61%), UK (7%), Canada (5%), Germany (4%), or Australia (2%); 26% were based in Europe. Thirty countries had at least 20 respondents in the sample, allowing for a more detailed view of salary by region. We should note that, even so, not every country is assigned a separate coefficient: coefficients are chosen for world regions (usually continents) or for countries where salaries vary greatly from those in other countries in the region. We also note that the positive and negative USD dollar amounts quoted as coefficients are only the beginning of a salary estimate: more coefficients will be added later on.
Salaries in Europe were particularly uneven, and the model assigned numerous coefficients to Europe. Northern/Western Europe tended to have higher salaries (+$17,443), while salaries in Switzerland (+$53,983) and the United Kingdom (+$25,782) were high enough to be given coefficients of their own. Developer salaries fall as we head into France (+$2,017), and further south into Spain, Portugal, Italy, Greece, and Turkey ($5,163). Eastern Europe had a coefficient of $14,804.
Font size:
Interval:
Bookmark:
Similar books «2016 Software Development Salary Survey»
Look at similar books to 2016 Software Development Salary Survey. We have selected literature similar in name and meaning in the hope of providing readers with more options to find new, interesting, not yet read works.
Discussion, reviews of the book 2016 Software Development Salary Survey and just readers' own opinions. Leave your comments, write what you think about the work, its meaning or the main characters. Specify what exactly you liked and what you didn't like, and why you think so.