Roger Magoulas - 2017 Software Development Salary Survey
Here you can read online Roger Magoulas - 2017 Software Development Salary Survey full text of the book (entire story) in english for free. Download pdf and epub, get meaning, cover and reviews about this ebook. City: Place of publication not identified, year: 2017, publisher: OReilly Media, Inc., genre: Politics. Description of the work, (preface) as well as reviews are available. Best literature library LitArk.com created for fans of good reading and offers a wide selection of genres:
Romance novel
Science fiction
Adventure
Detective
Science
History
Home and family
Prose
Art
Politics
Computer
Non-fiction
Religion
Business
Children
Humor
Choose a favorite category and find really read worthwhile books. Enjoy immersion in the world of imagination, feel the emotions of the characters or learn something new for yourself, make an fascinating discovery.

- Book:2017 Software Development Salary Survey
- Author:
- Publisher:OReilly Media, Inc.
- Genre:
- Year:2017
- City:Place of publication not identified
- Rating:4 / 5
- Favourites:Add to favourites
- Your mark:
2017 Software Development Salary Survey: summary, description and annotation
We offer to read an annotation, description, summary or preface (depends on what the author of the book "2017 Software Development Salary Survey" wrote himself). If you haven't found the necessary information about the book — write in the comments, we will try to find it.
Abstract: The results from OReillys second annual Software Development Salary Survey are inches This anonymous online survey ran last fall and attracted more than 6,800 programmers, tech leads, managers, and students-an increase of more than 1,000 respondents compared to 2016. Respondents hailed from 110 countries, as well as all 50 US states and the District of Columbia. This report explores the landscape of professionals working in all facets of software development, including the relationship between roles, location, company size, industry, and earnings. If youre looking to change jobs, about to have your annual employee review, or moving to a new town, this report will help you benchmark your skills and salary expectations. Youll learn where you fit and how you might leverage these potentially career-changing findings. With this report, youll learn: The top programming languages that respondents currently use professionally Where programmers make the highest salaries-by country and by regions in the US Salary ranges by industry and by specific programming language The difference in earnings between programmers who work on tiny teams vs. those work on larger teams The most common programming languages that respondents no longer use in their work Which programming languages respondents intend to learn within the next couple of years We hope you will find the information in this report useful. To stay up-to-date on this research, your participation is crucial. The survey is now open for the 2018 report, and we encourage you to take just 5 to 10 minutes to participate here: oreilly.com/programming/2018-programming-salary-survey.html
Roger Magoulas: author's other books
Who wrote 2017 Software Development Salary Survey? Find out the surname, the name of the author of the book and a list of all author's works by series.


2017 Software Development Salary Survey — read online for free the complete book (whole text) full work
Below is the text of the book, divided by pages. System saving the place of the last page read, allows you to conveniently read the book "2017 Software Development Salary Survey" online for free, without having to search again every time where you left off. Put a bookmark, and you can go to the page where you finished reading at any time.
Font size:
Interval:
Bookmark:
by Brian Suda and Roger Magoulas
Copyright 2017 OReilly Media Inc.. All rights reserved.
Printed in the United States of America.
Published by OReilly Media, Inc. , 1005 Gravenstein Highway North, Sebastopol, CA 95472.
OReilly books may be purchased for educational, business, or sales promotional use. Online editions are also available for most titles (.
- Editor: Dawn Schanafelt
- Cover Designer: Ellie Volckhausen
- Production Editor: Shiny Kalapurakkel
- April 2017: First Edition
- 2017-04-10: First Release
The OReilly logo is a registered trademark of OReilly Media, Inc. The cover image, and related trade dress are trademarks of OReilly Media, Inc.
The views expressed in this work are those of the authors, and do not represent the publishers views. While the publisher and the authors have used good faith efforts to ensure that the information and instructions contained in this work are accurate, the publisher and the authors disclaim all responsibility for errors or omissions, including without limitation responsibility for damages resulting from the use of or reliance on this work. Use of the information and instructions contained in this work is at your own risk. If any code samples or other technology this work contains or describes is subject to open source licenses or the intellectual property rights of others, it is your responsibility to ensure that your use thereof complies with such licenses and/or rights.
978-1-491-98185-6
THIS REPORT EXPLORES THE LANDSCAPE of the professionalsworking in all facets of software development, includingdetails about the relationship between roles, location,company size, industry, and earnings. The results are basedon more than 6,800 responses collected via an online survey.We paid special attention to the variables that correlate withsalary, but its not just about money: we also analyzed whattools, tasks, and organizational processes respondents mostcommonly use.
In this, our second annual Software Development SalarySurvey, we find some consistency in what matters to softwaredevelopers. Much like last year, our results show that thebetter-paying jobs tend to concentrate in tech centers, thatexperience matters more than age, and that knowing moretools, working with more people in a wider variety of roles,and working for larger organizations all correlate with higherwages. And, the data shows that knowing when to hold emand when to fold em (i.e., self-reported good negotiatingskills) might be a key to higher salaries.
The median salary this year was down worldwide comparedto last year, likely caused by a drop in the share of highlypaid US-based respondents and a currency exchange-baseddecline for Western Europeans who made up a larger share ofsurvey participants compared to last year.
Other key findings from this report include:
US respondents, particularly those in California, report the highest salaries.
The larger the company, the higher the reported salaries (the small cohort of one-person organization is an exception, with reported salaries higher than respondents at organizations with less than 1,000 employees).
Compared to last year, there was no real salary change for respondents working at large companies.
Software industry respondents (by far the largest share of survey participants) and consultants reported the lowest median income.
Those self-reporting a high level of negotiating and bargaining skills also reported the highest median incomes.
As with the other salary surveys weve run, those attending the most meetingsa proxy for higher levels of responsibilityreport the highest incomes.
We hope that you will find the information in this reportuseful. If you can spare 510 minutes, go take the surveyyourself: http://oreilly.com/programming/2018-programming-salary-survey.html.
You can download last years survey from http://oreilly.com/ideas/2016-software-development-salary-survey-report.
THE RESULTS FROM OREILLYS SECOND ANNUALSOFTWARE DEVELOPMENT SALARY SURVEY ARE IN.This anonymous online survey ran last fall and winter and attractedmore than 6,800 programmers, tech leads, managers,and studentsan increase of more than 1,000 respondentscompared to 2016. The respondents were from 110 countries,including all 50 US states and the District of Columbia.
Use data from the report to compare yourself to others atsimilar companies and positions, and find out what roles,tools, work styles, organizational skills, and work environmentscorrelate with the highest salaries.
If you are looking to change jobs, about to have your annualemployee review, or moving to a new town, this report willhelp you benchmark your skills and salary expectations. Youlllearn where you fit and how you might leverage these potentiallycareer-changing findings.
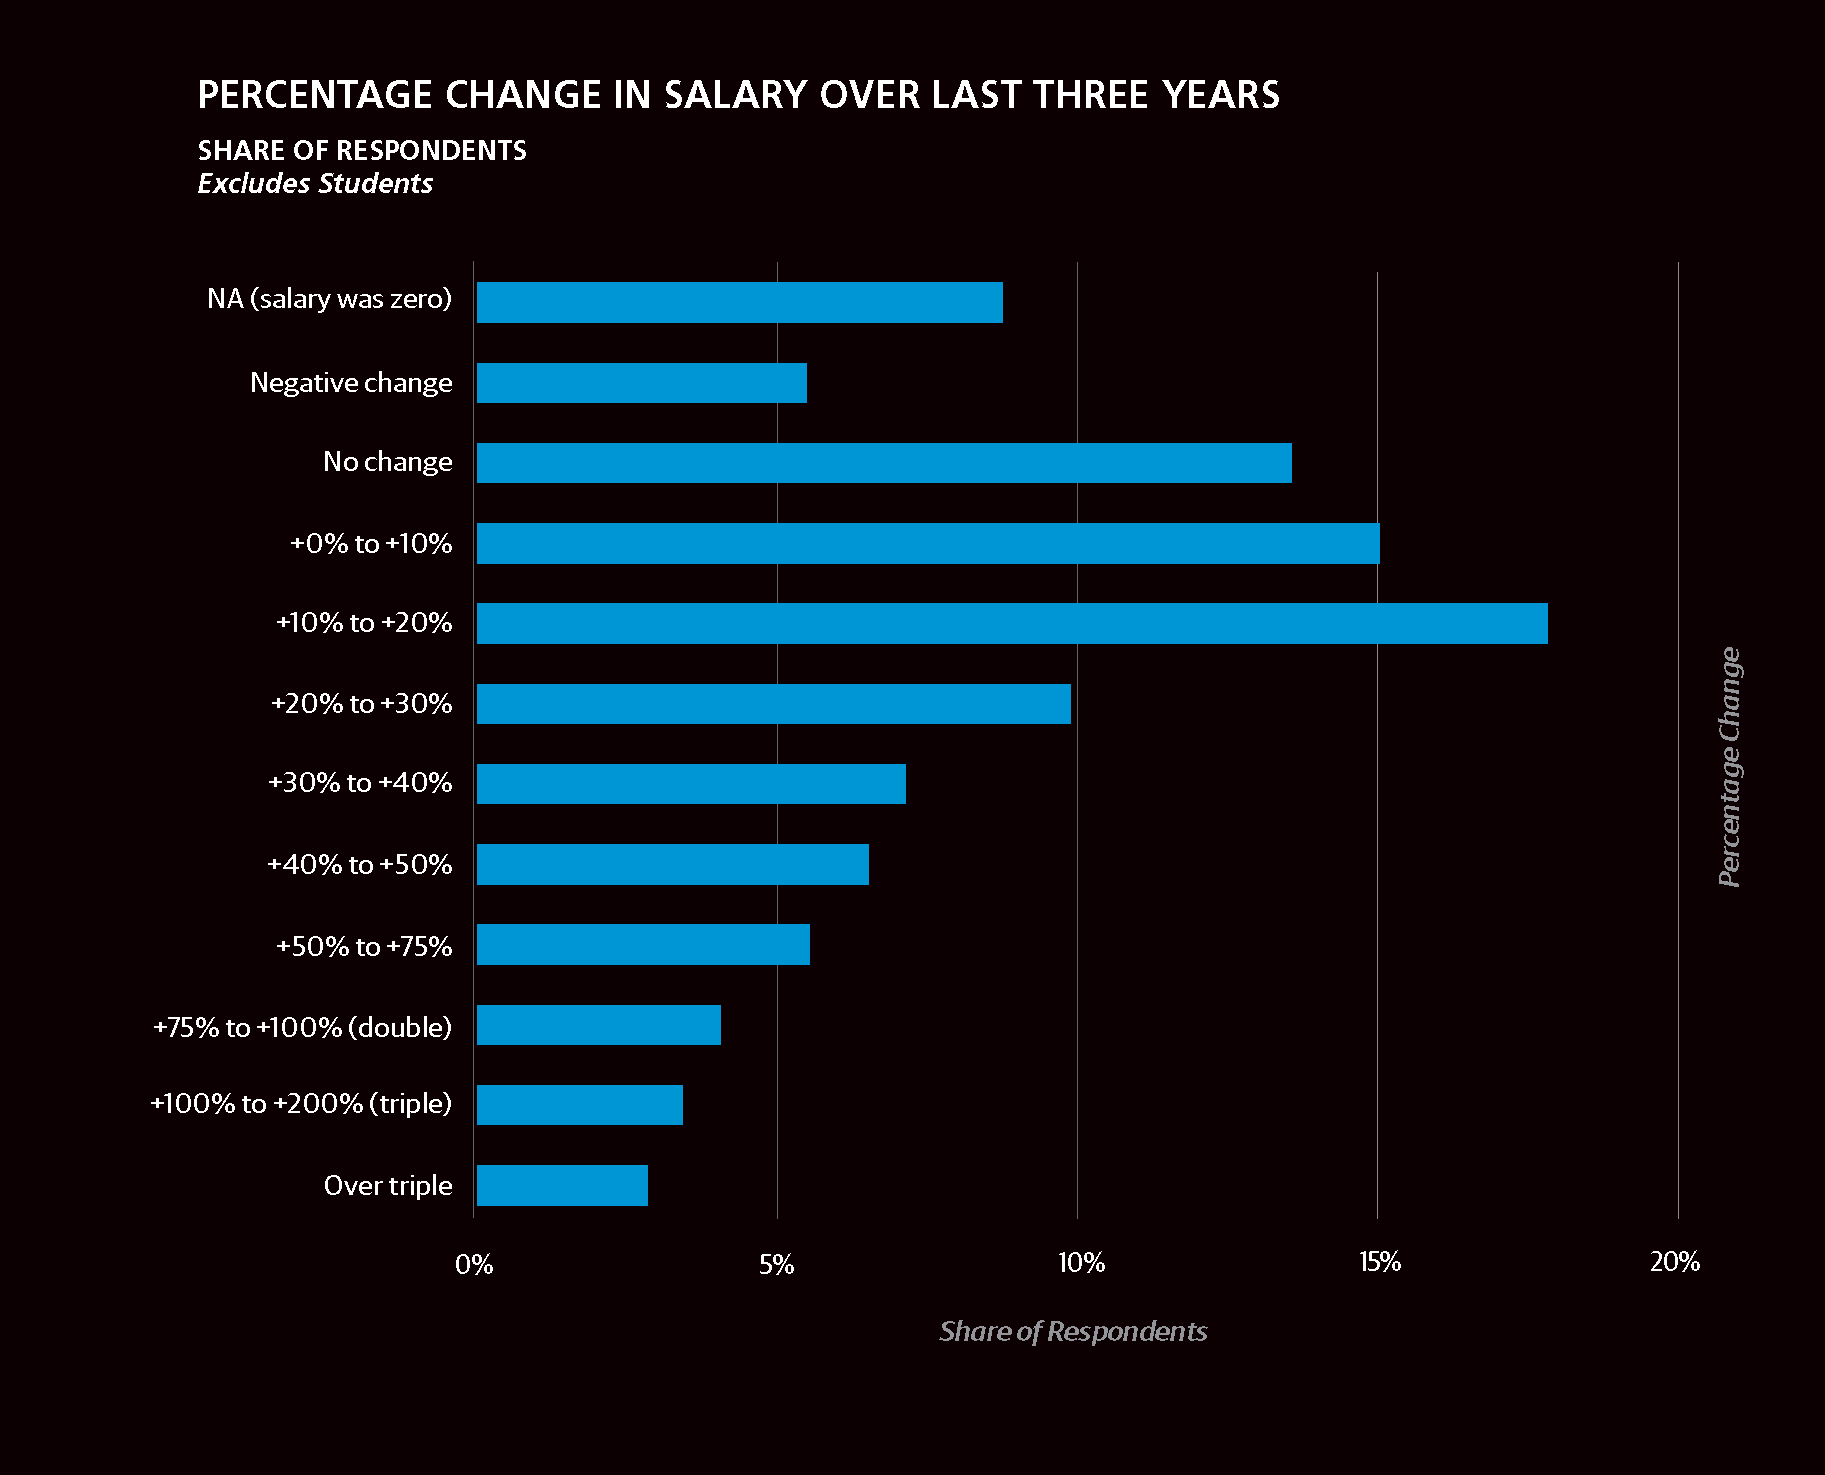
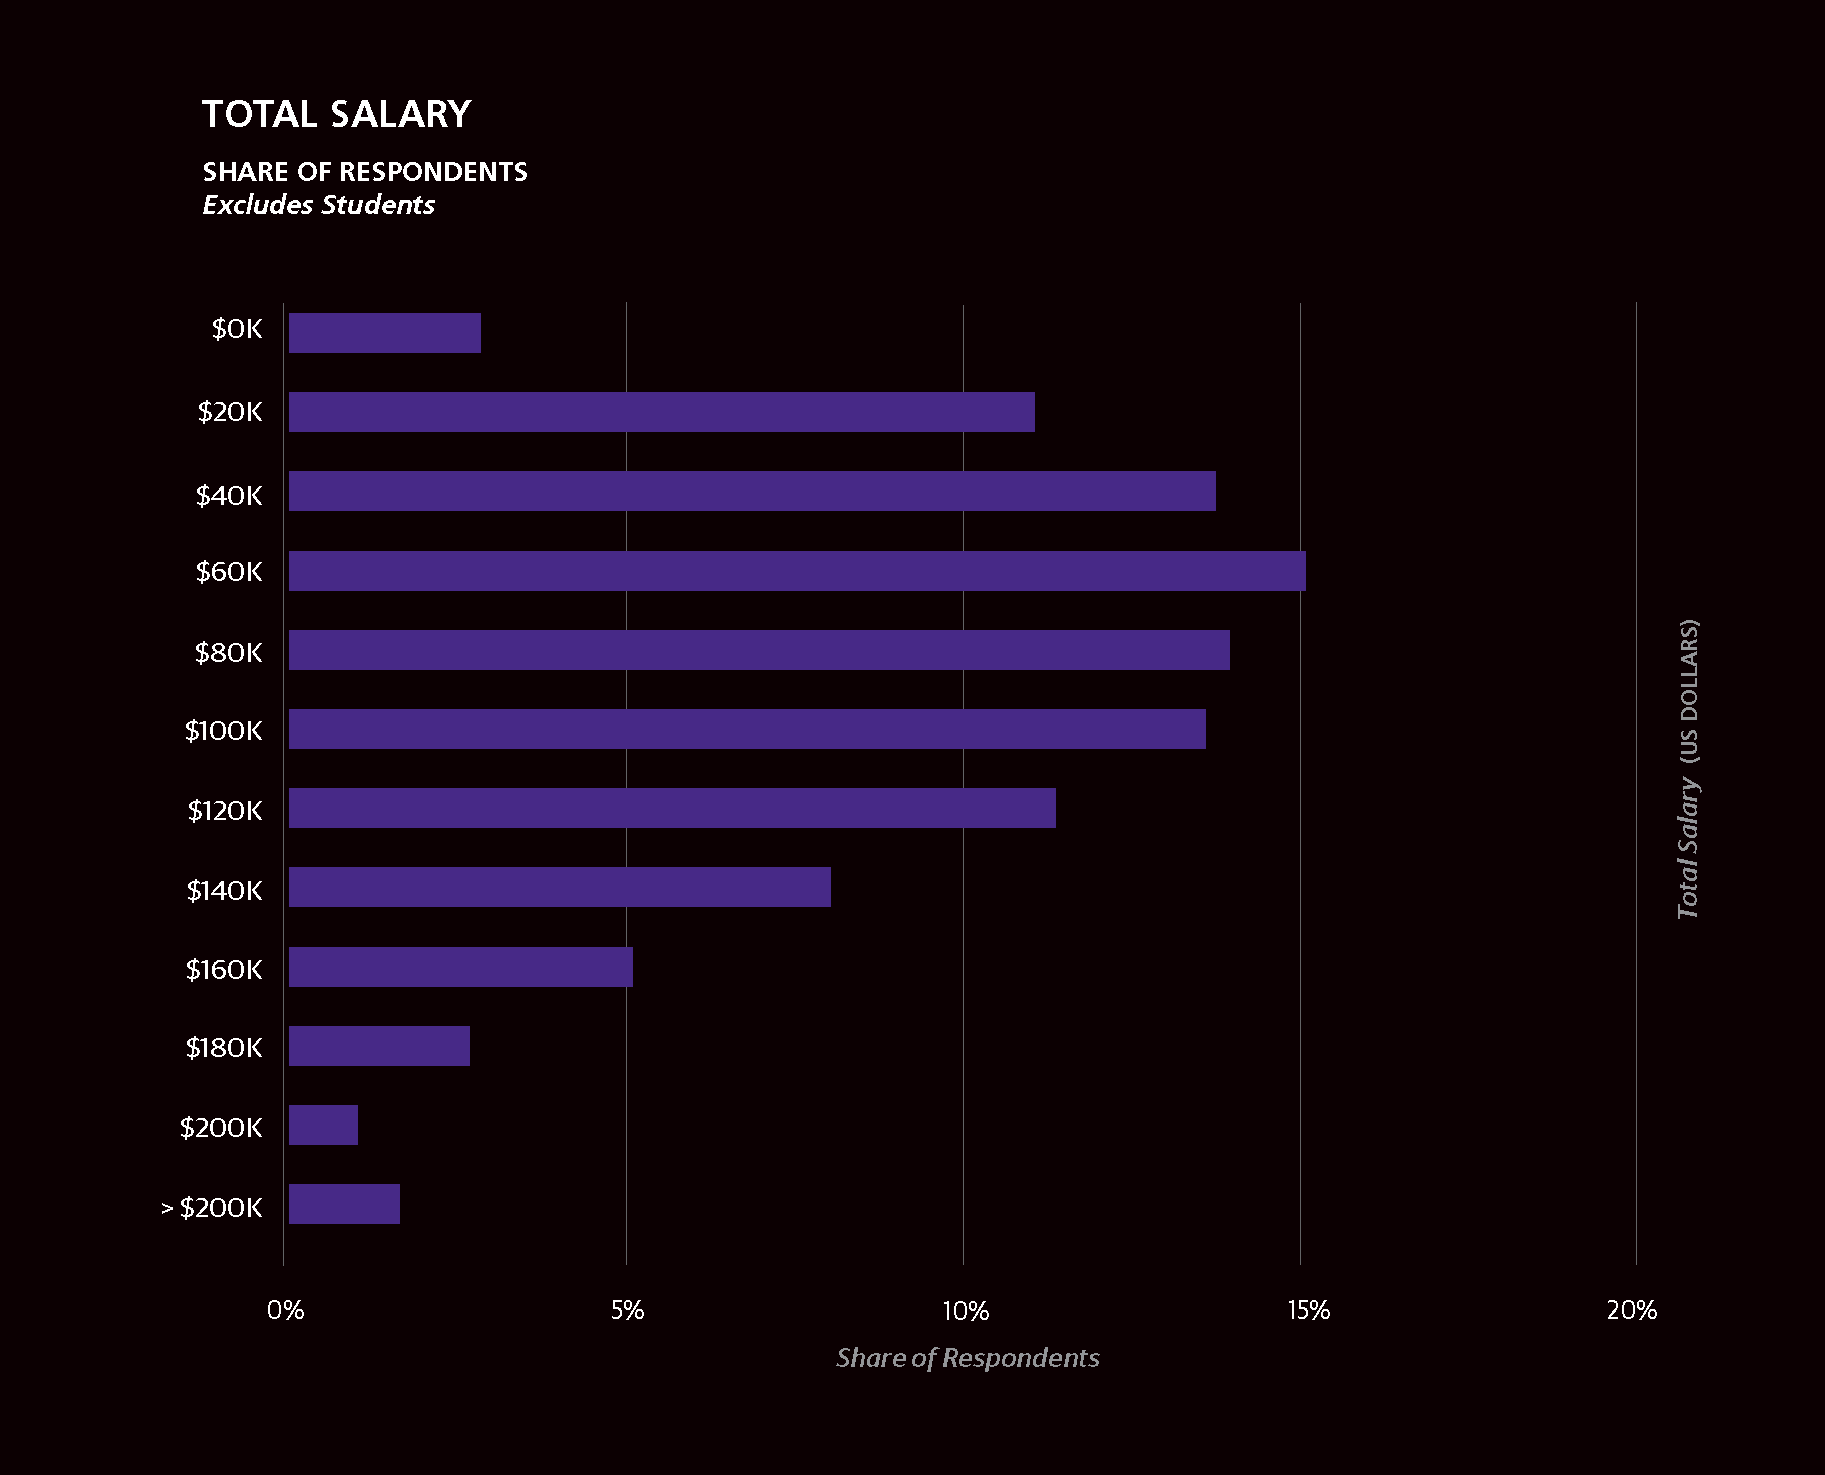
When calculating salary values, we omitted responses frompeople who identified themselves as students (about 6.5% ofrespondents) to offset the negative skew on reported earningsfrom those trying to balance part-time or full-time work withtheir academic load. All salary numbers in this report exclude students,but student responses are used in some charts to compareskills and tools used by students versus professionals.
COMPARED TO THE 2016 SURVEY, SALARIES AREDOWN ABOUT $10,000 despite an increase in salaries fromUS respondents. Heres whats behind this drop:
US respondents report much higher median salaries than the rest of the world: $115K in 2017, up about 5% over 2016.
The share of US respondents dropped from 61% to 46% of our total.
Western European respondents reported lower salaries ($58K), nearly 7% lower than what was reported last year.
European salaries were effectively reduced by the rising value of the US Dollar compared to the British Pound (up 16%) and Euro (up 8%) compared to 2016.
The share of Western European respondents increased from 20% to 26%.
US respondents reportmuch higher mediansalaries than therest of the world.
Countries with varying supply and demand conditions, differenthealthcare and tax regimes, volatile exchange rates, and other factors all make comparing salaries worldwide difficultat best. For a non-numerical perspective on salaries, weasked respondents to rate their satisfaction with their salaries.Despite the differences in salaries bycountry and region, about 50% of thenon-student respondents were satisfied,31% were neutral, leaving onlyabout 20% unhappy with what theymake.
Students show a less happy picture,with 37% positive toward their salaries,29% neutral, and 34% unhappy.The most unsatisfied student groupseem justified in their gloom, with a median salary of justover $11K!
In the horizontal bar charts throughout this report, we includethe interquartile range (IQR) to show the middle 50% ofrespondents answers to questions such as salary. One quarterof the respondents has a salary below the displayed range,and one quarter has a salary above the displayed range.
Font size:
Interval:
Bookmark:
Similar books «2017 Software Development Salary Survey»
Look at similar books to 2017 Software Development Salary Survey. We have selected literature similar in name and meaning in the hope of providing readers with more options to find new, interesting, not yet read works.
Discussion, reviews of the book 2017 Software Development Salary Survey and just readers' own opinions. Leave your comments, write what you think about the work, its meaning or the main characters. Specify what exactly you liked and what you didn't like, and why you think so.