Roger Magoulas - 2013 Data Science Salary Survey
Here you can read online Roger Magoulas - 2013 Data Science Salary Survey full text of the book (entire story) in english for free. Download pdf and epub, get meaning, cover and reviews about this ebook. City: Place of publication not identified, year: 2014, publisher: OReilly Media, Inc., genre: Politics. Description of the work, (preface) as well as reviews are available. Best literature library LitArk.com created for fans of good reading and offers a wide selection of genres:
Romance novel
Science fiction
Adventure
Detective
Science
History
Home and family
Prose
Art
Politics
Computer
Non-fiction
Religion
Business
Children
Humor
Choose a favorite category and find really read worthwhile books. Enjoy immersion in the world of imagination, feel the emotions of the characters or learn something new for yourself, make an fascinating discovery.
- Book:2013 Data Science Salary Survey
- Author:
- Publisher:OReilly Media, Inc.
- Genre:
- Year:2014
- City:Place of publication not identified
- Rating:5 / 5
- Favourites:Add to favourites
- Your mark:
2013 Data Science Salary Survey: summary, description and annotation
We offer to read an annotation, description, summary or preface (depends on what the author of the book "2013 Data Science Salary Survey" wrote himself). If you haven't found the necessary information about the book — write in the comments, we will try to find it.
Abstract: What tools do successful data scientists and analysts use, and how much money do they make? We surveyed hundreds of attendees at the OReilly Strata Conferences in Santa Clara, California and New York to understand. Findings from the survey include: Average number of tools and median income for all respondents Distribution of responses by age, location, industry, and position Detailed analysis of tools used by respondents and correlation to their salaries - including by tool clusters (Hadoop, SQL/Excel, and other) Correlation of specialized big data tools usage and salary What tools should you be learning and using? Read this valuable report to gain insight from these potentially career-changing findings
Roger Magoulas: author's other books
Who wrote 2013 Data Science Salary Survey? Find out the surname, the name of the author of the book and a list of all author's works by series.

2013 Data Science Salary Survey — read online for free the complete book (whole text) full work
Below is the text of the book, divided by pages. System saving the place of the last page read, allows you to conveniently read the book "2013 Data Science Salary Survey" online for free, without having to search again every time where you left off. Put a bookmark, and you can go to the page where you finished reading at any time.
Font size:
Interval:
Bookmark:
by John King and Roger Magoulas
Copyright 2014 OReilly Media. All rights reserved.
Printed in the United States of America.
Published by OReilly Media, Inc. , 1005 Gravenstein Highway North, Sebastopol, CA 95472.
OReilly books may be purchased for educational, business, or sales promotional use. Online editions are also available for most titles (http://safaribooksonline.com). For more information, contact our corporate/institutional sales department: 800-998-9938 or corporate@oreilly.com .
- January 2014: First Edition
- 2014-01-13: First Release
The OReilly logo is a registered trademark of OReilly Media, Inc. 2013 Data Science Salary Survey and related trade dress are trademarks of OReilly Media, Inc.
While the publisher and the authors have used good faith efforts to ensure that the information and instructions contained in this work are accurate, the publisher and the authors disclaim all responsibility for errors or omissions, including without limitation responsibility for damages resulting from the use of or reliance on this work. Use of the information and instructions contained in this work is at your own risk. If any code samples or other technology this work contains or describes is subject to open source licenses or the intellectual property rights of others, it is your responsibility to ensure that your use thereof complies with such licenses and/or rights.
978-1-491-94914-6
[LSI]
OReilly Media conducted an anonymous salary and tools survey in 2012 and 2013 with attendees of the Strata Conference: Making Data Work in Santa Clara, California and Strata + Hadoop World in New York. Respondents from 37 US states and 33 countries, representing a variety of industries in the public and private sector, completed the survey.
We ran the survey to better understand which tools data analysts and data scientists use and how those tools correlate with salary. Not all respondents describe their primary role as data scientist/data analyst, but almost all respondents are exposed to data analytics. Similarly, while just over half the respondents described themselves as technical leads, almost all reported that some part of their role included technical duties (i.e., 1020% of their responsibilities included data analysis or software development).
We looked at which tools correlate with others (if respondents use one, are they more likely to use another?) and created a network graph of the positive correlations. Tools could then be compared with salary, either individually or collectively, based on where they clustered on the graph.
We found:
By a significant margin, more respondents used SQL than any other tool (71% of respondents, compared to 43% for the next highest ranked tool, R).
The open source tools R and Python, used by 43% and 40% of respondents, respectively, proved more widely used than Excel (used by 36% of respondents).
Salaries positively correlated with the number of tools used by respondents. The average respondent selected 10 tools and had a median income of $100k; those using 15 or more tools had a median salary of $130k.
Two clusters of correlating tool use: one consisting of open source tools (R, Python, Hadoop frameworks, and several scalable machine learning tools), the other consisting of commercial tools such as Excel, MSSQL, Tableau, Oracle RDB, and BusinessObjects.
Respondents who use more tools from the commercial cluster tend to use them in isolation, without many other tools.
Respondents selecting tools from the open source cluster had higher salaries than respondents selecting commercial tools. For example, respondents who selected 6 of the 19 open source tools had a median salary of $130k, while those using 5 of the 13 commercial cluster tools earned a median salary of $90k.
NoteWe suspect that a scarcity of resources trained in the newer open source tools creates demand that bids up salaries compared to the more mature commercial cluster tools.
Big data can be described as both ordinary and arcane. The basic premise behind its genesis and utility are as simple as its name: efficient access to moremuch moredata can transform how we understand and solve major problems for business and government. On the other hand, the field of big data has ushered in the arrival of new, complex tools that relatively few people understand or have even heard of. But is it worth learning them?
If you have any involvement in data analytics and want to develop your career, the answer is yes. At the last two Strata conferences (New York 2012 and Santa Clara 2013), we collected surveys from our attendees about, among other things, the tools they use and their salaries. Heres what we found:
Several open source tools used in analytics such as R and Python are just as important, or even more so, than traditional data tools such as SAS or Excel.
Some traditional tools such as Excel, SAS, and SQL are used in relative isolation.
Using a wider variety of toolsprogramming languages, visualization tools, relational database/Hadoop platformscorrelates with higher salary.
Using more tools tailored to working with big data, such as MapR, Cassandra, Hive, MongoDB, Apache Hadoop, and Cloudera, also correlates with higher salary.
We should note that Strata attendees comprise a special group and do not form an unbiased sample of everyone who seriously works with data. These are people deeply involved with or interested in big data, seeking to network with others on the fields cutting edge and learn about the new technologies defining itin short, they are ahead of the curve. If a trend observed in the sample is not consistent with what would be observed in the larger population (of analysts, data scientists, and so on), then this trend could represent the direction big data is headed. This is likely to be the case for tool usage.
The majority of the surveys respondents were from the US, with most of the rest coming from Canada and Europe. Among those from the US, 68% were from states on either coast.
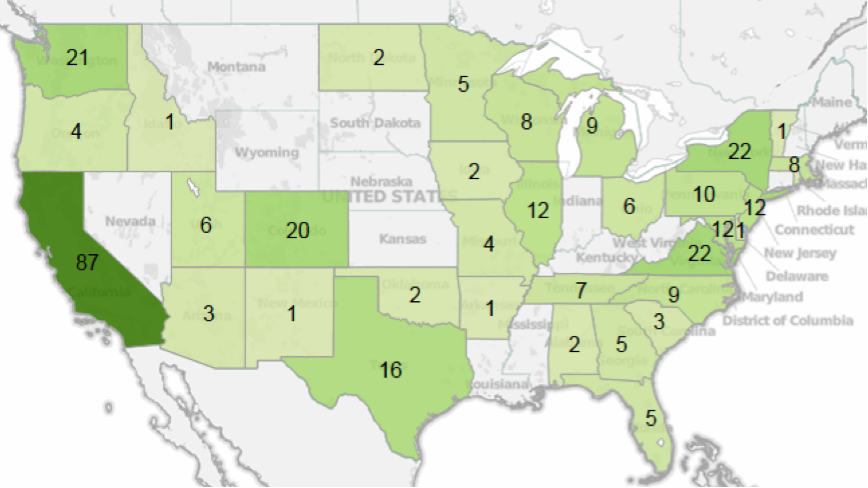
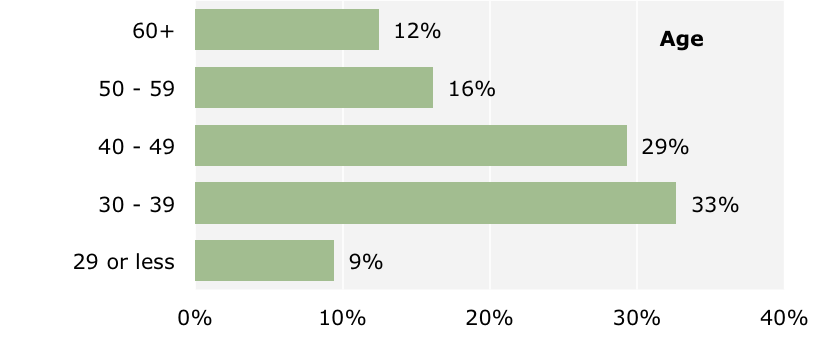
Our sample represented a wide range of ages, with most respondents in their thirties and forties. About 40% of respondents were based in the West, while the rest of the respondents were evenly distributed in the Northeast, Mid-Atlantic, South, and Midwest regions. California, Maryland, and Washington had the highest median salaries, while respondents in the South and Midwest reported the lowest median salaries.
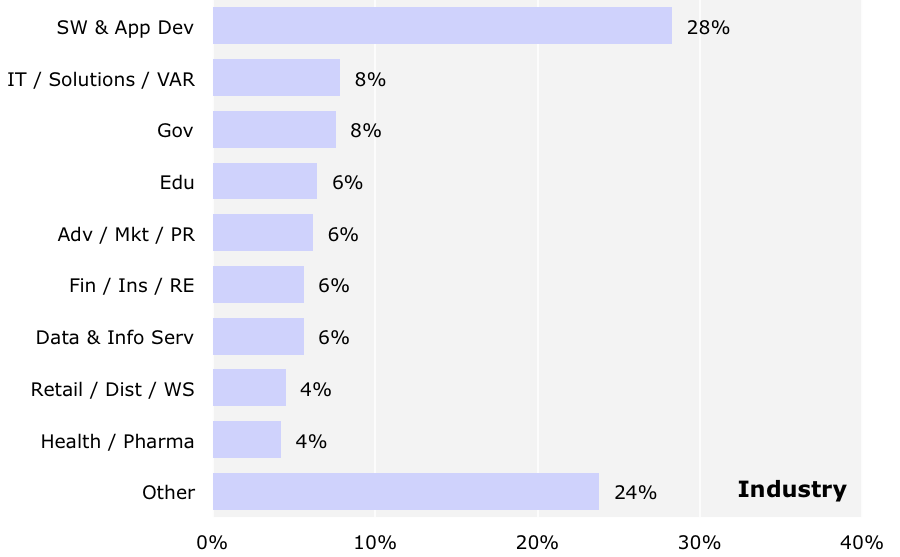
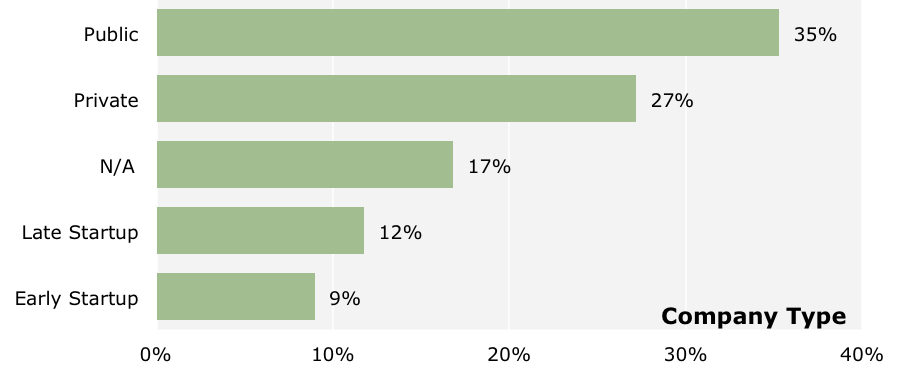
Twenty-three industries were represented (those with at least 10 respondents are shown above) and about one-fifth came from startups. A significant share of respondents, 42%, work in software-oriented segments: software and application development, IT/solutions/VARs, data and information services, and manufacturing/design (IT/OEM). Government and education represent 14% of respondents. About 21% of those responding work for startupswith early startups, surprisingly, showing the highest median salary, $130k. Public companies had a median salary of $110k, private companies $100k and N/A (mostly government and education) at $80k.
Font size:
Interval:
Bookmark:
Similar books «2013 Data Science Salary Survey»
Look at similar books to 2013 Data Science Salary Survey. We have selected literature similar in name and meaning in the hope of providing readers with more options to find new, interesting, not yet read works.
Discussion, reviews of the book 2013 Data Science Salary Survey and just readers' own opinions. Leave your comments, write what you think about the work, its meaning or the main characters. Specify what exactly you liked and what you didn't like, and why you think so.