Roger Magoulas - 2017 European Data Science Salary Survey
Here you can read online Roger Magoulas - 2017 European Data Science Salary Survey full text of the book (entire story) in english for free. Download pdf and epub, get meaning, cover and reviews about this ebook. publisher: OReilly Media, Inc., genre: Politics. Description of the work, (preface) as well as reviews are available. Best literature library LitArk.com created for fans of good reading and offers a wide selection of genres:
Romance novel
Science fiction
Adventure
Detective
Science
History
Home and family
Prose
Art
Politics
Computer
Non-fiction
Religion
Business
Children
Humor
Choose a favorite category and find really read worthwhile books. Enjoy immersion in the world of imagination, feel the emotions of the characters or learn something new for yourself, make an fascinating discovery.

- Book:2017 European Data Science Salary Survey
- Author:
- Publisher:OReilly Media, Inc.
- Genre:
- Rating:4 / 5
- Favourites:Add to favourites
- Your mark:
2017 European Data Science Salary Survey: summary, description and annotation
We offer to read an annotation, description, summary or preface (depends on what the author of the book "2017 European Data Science Salary Survey" wrote himself). If you haven't found the necessary information about the book — write in the comments, we will try to find it.
How do data science salaries for people in Europe compare to their counterparts in the rest of the world? Among the more than 1000 people who responded to OReillys 2016 Data Science Salary Survey, 359 live and work in various European countries as data scientists, analysts, engineers, and related professions.
This report takes a deep dive into the survey results from respondents in various regions of Europe, including the tools they use, the compensation they receive, and the roles they play in their respective organizations. Even if you didnt take part in the survey, you can still plug your own information into the surveys simple linear model to see where you fit.
With this report, youll learn:
- How salaries vary by country and specific regions in Europe
- Average size of companies by region
- How salary is affected by a countrys GDP
- Top industries for data scientists, including software, banking, finance, retail, and ecommerce
- Most commonly used tools vs tools used by respondents with above-average salaries
- Primary and secondary job tasks performed by survey respondents
To stay up-to-date on this research, your participation is crucial. The survey is now open for the 2017 report; please take just 5 to 10 minutes to participate in the survey here.
Roger Magoulas: author's other books
Who wrote 2017 European Data Science Salary Survey? Find out the surname, the name of the author of the book and a list of all author's works by series.


2017 European Data Science Salary Survey — read online for free the complete book (whole text) full work
Below is the text of the book, divided by pages. System saving the place of the last page read, allows you to conveniently read the book "2017 European Data Science Salary Survey" online for free, without having to search again every time where you left off. Put a bookmark, and you can go to the page where you finished reading at any time.
Font size:
Interval:
Bookmark:
by John King and Roger Magoulas
Copyright 2016 OReilly Media Inc. All rights reserved.
Printed in Canada.
Published by OReilly Media, Inc. , 1005 Gravenstein Highway North, Sebastopol, CA 95472.
OReilly books may be purchased for educational, business, or sales promotional use. Online editions are also available for most titles (.
- Editor: Shannon Cutt
- Cover Designer: Ellie Volckhausen
- Production Editor: Shiny Kalapurakkel
- February 2017: First Edition
- 2017-02-10: First Release
The OReilly logo is a registered trademark of OReilly Media, Inc. The cover image, and related trade dress are trademarks of OReilly Media, Inc.
The views expressed in this work are those of the authors, and do not represent the publishers views. While the publisher and the authors have used good faith efforts to ensure that the information and instructions contained in this work are accurate, the publisher and the authors disclaim all responsibility for errors or omissions, including without limitation responsibility for damages resulting from the use of or reliance on this work. Use of the information and instructions contained in this work is at your own risk. If any code samples or other technology this work contains or describes is subject to open source licenses or the intellectual property rights of others, it is your responsibility to ensure that your use thereof complies with such licenses and/or rights.
978-1-491-97750-7
[TI]
In 2016, OReilly Media conducted a data science salary survery online. The survey contained 40questions about the respondents roles, tools, compensation,and demographic backgrounds. About 1,000 data scientists,analysts, engineers, and other professionalsworking in Data participated in thesurvey359 of them from Europeancountries. Here, wetake a deep dive into the results fromrespondents based in Europe, exploringcareer details and factors thatinfluence salary. Some key findingsinclude:
Most of the variation in salaries can be attributed to differences in the local economy
Data professionals who use Hadoop and Spark earn more
Among those who use R or Python, users of both have the highest salaries
A few technical tasks correlate with higher salaries: developing prototype models, setting up/maintaining data platforms, and developing products that depend on real-time analytics
Respondents who use Hadoop, Spark, or Python were twice as likely to have a major increase in salary over the last three years, compared with those whose stack consists of Excel and relational databases
Respondents who use Hadoop, Spark, or Python were twice as likely to have a major increase in salary over the last three years.
We hope that these findings will beuseful as you develop your career in data science.
SINCE 2013, WE HAVE CONDUCTED AN ONLINE SALARYSURVEY FOR DATA PROFESSIONALS and published areport on our findings. US respondents typically dominatethe sample, at about 60%70%. Although many of thefindings do appear to apply to people across the globe, wethought it would be useful to show results specific to Europe,looking at finer geographical details and identifying any patternsthat seem to only apply to Europe. In this report, we pool all359 European respondents from the Data Salary Survey over a13-month period: September 2015 to October 2016.
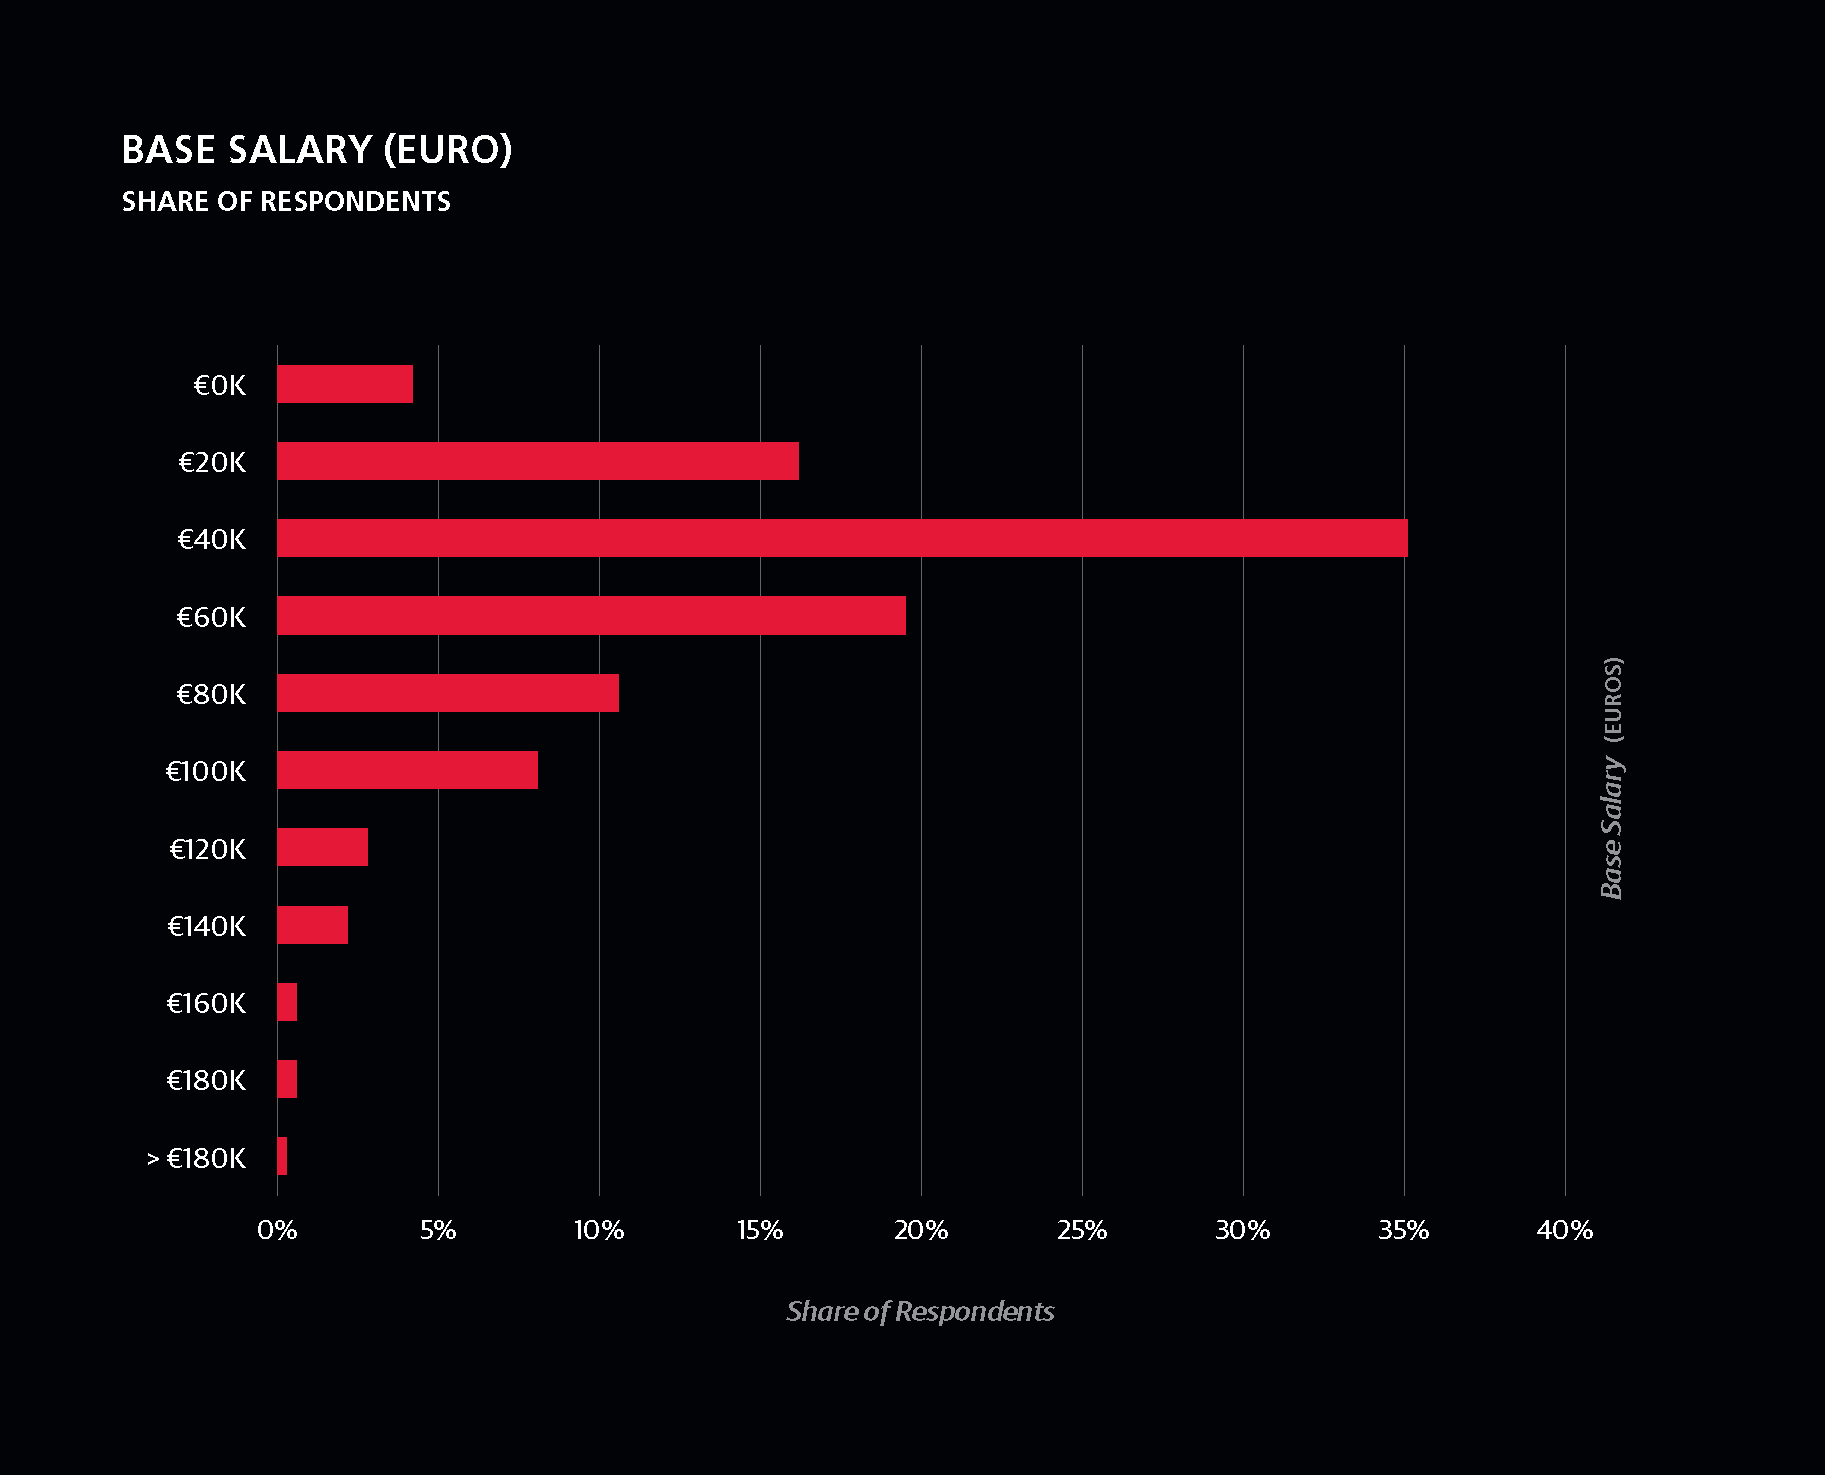
The median salary of European respondents was 48K,but the spread was huge. For example, the top third earnedalmost four times on average as the bottom third. Such alarge variance is not surprising due to the differences in theper capita income of countries represented.
A note on currency: we requested responses about salariesand other monetary amounts in US dollars. In this report, wehave converted all amounts into euros, though many Europeanrespondents are paid in other currencies, such as pounds orrubles. Over the period in which responses were collected,there were some important shifts in exchange rates, mostnotably the fall of the pound after Brexit. However, thegeographical distribution of responses did not correlate in anymeaningful way with any period of collection (e.g., when thepound was high or low), so these currency fluctuations likelytranslate into noise rather than bias.
In the horizontal bar charts throughout this report, we includethe interquartile range (IQR) to show the middle 50% ofrespondents answers to questions such as salary. One quarterof the respondents have a salary below the displayed range,and one quarter have a salary above the displayed range.
The IQRs are represented by colored, horizontal bars. On eachof these colored bars, the white vertical band represents themedian value.
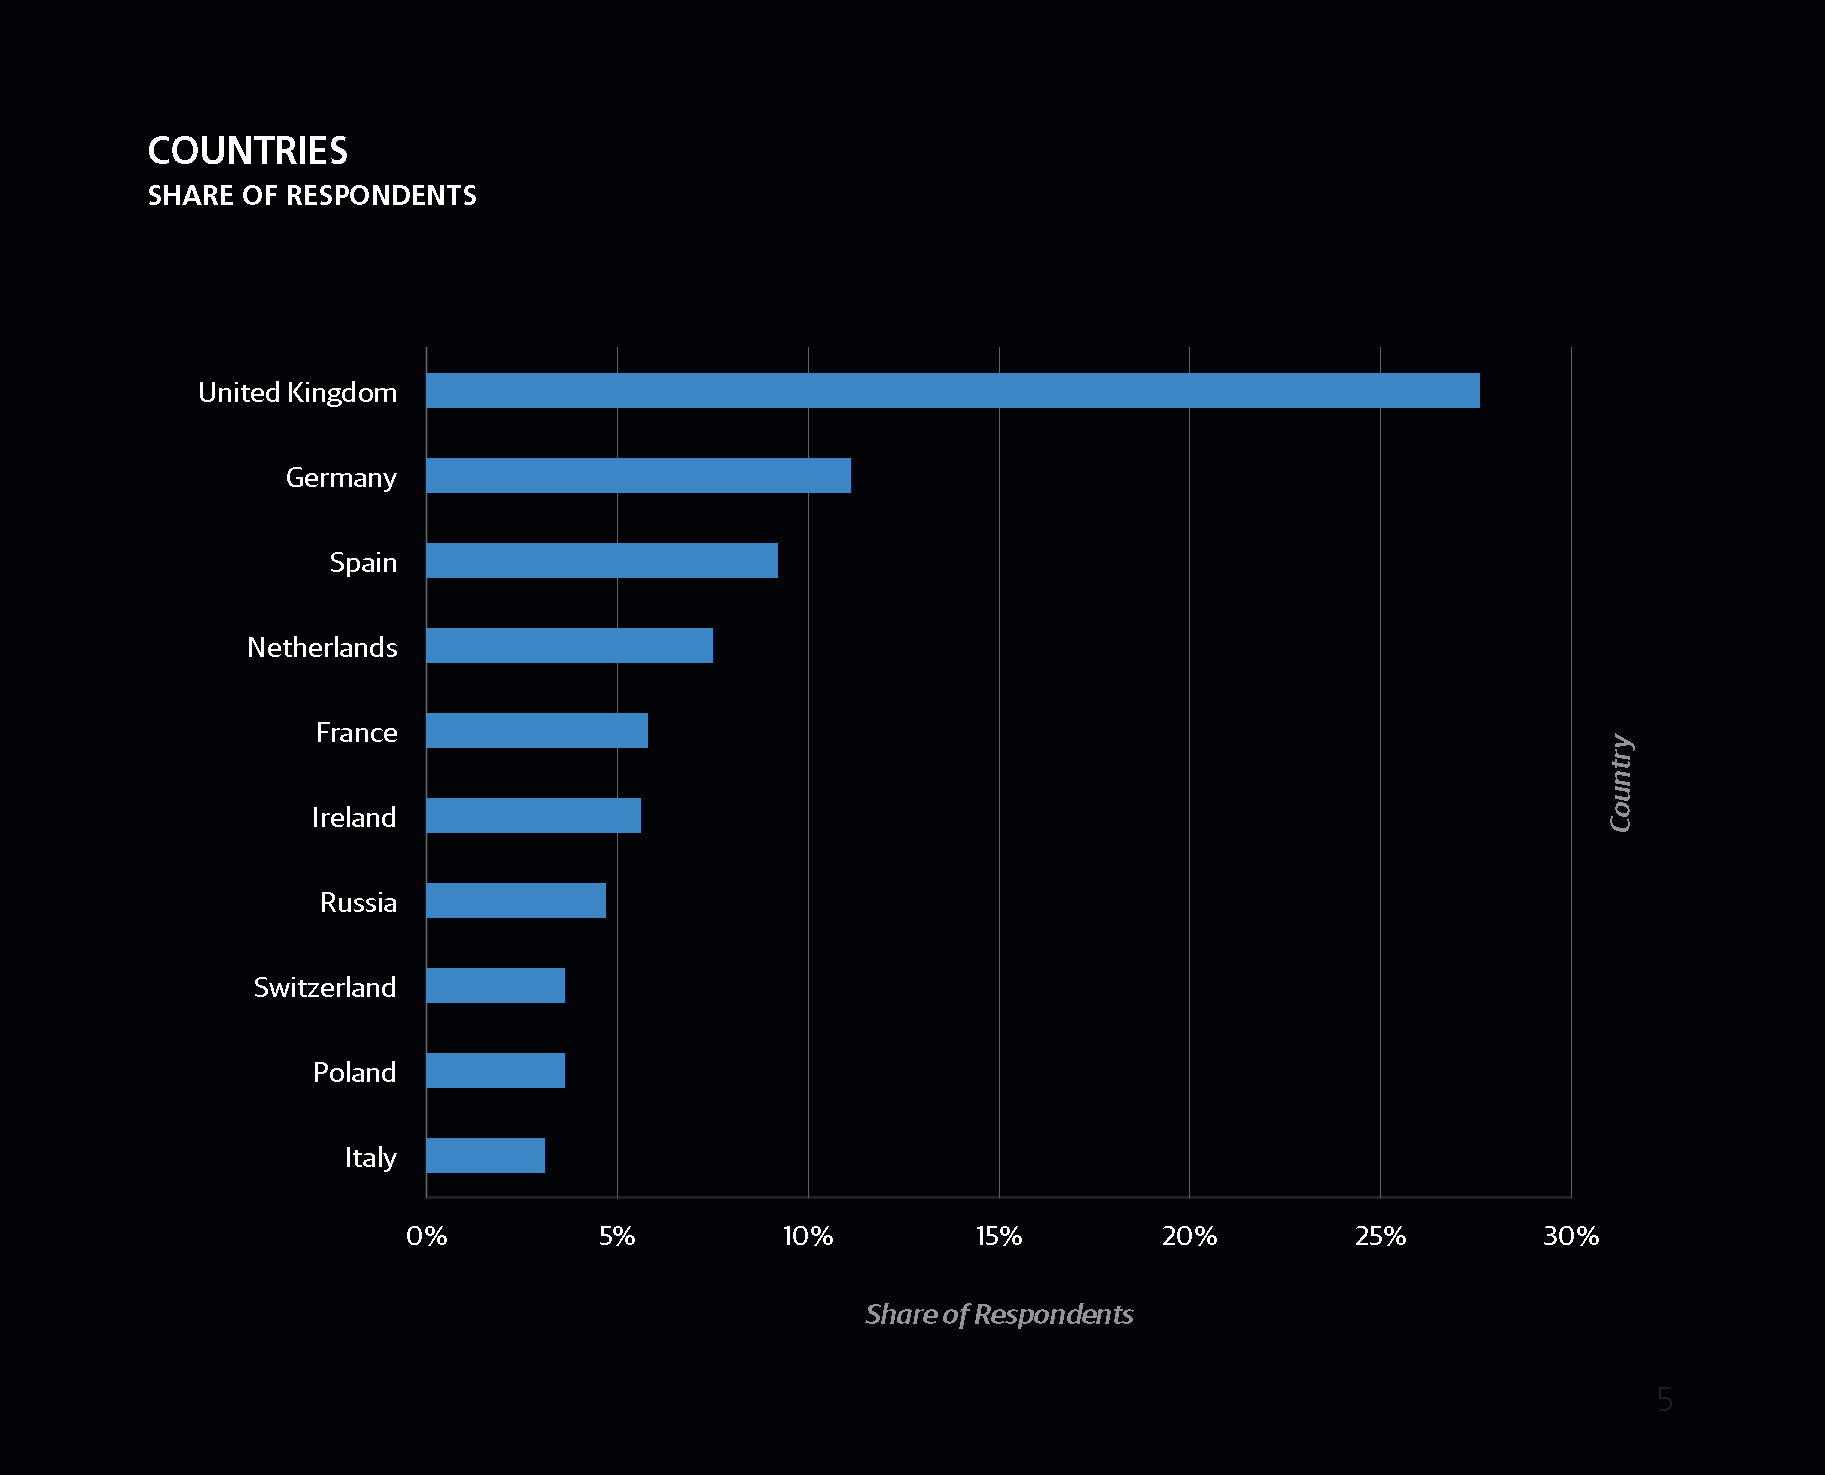
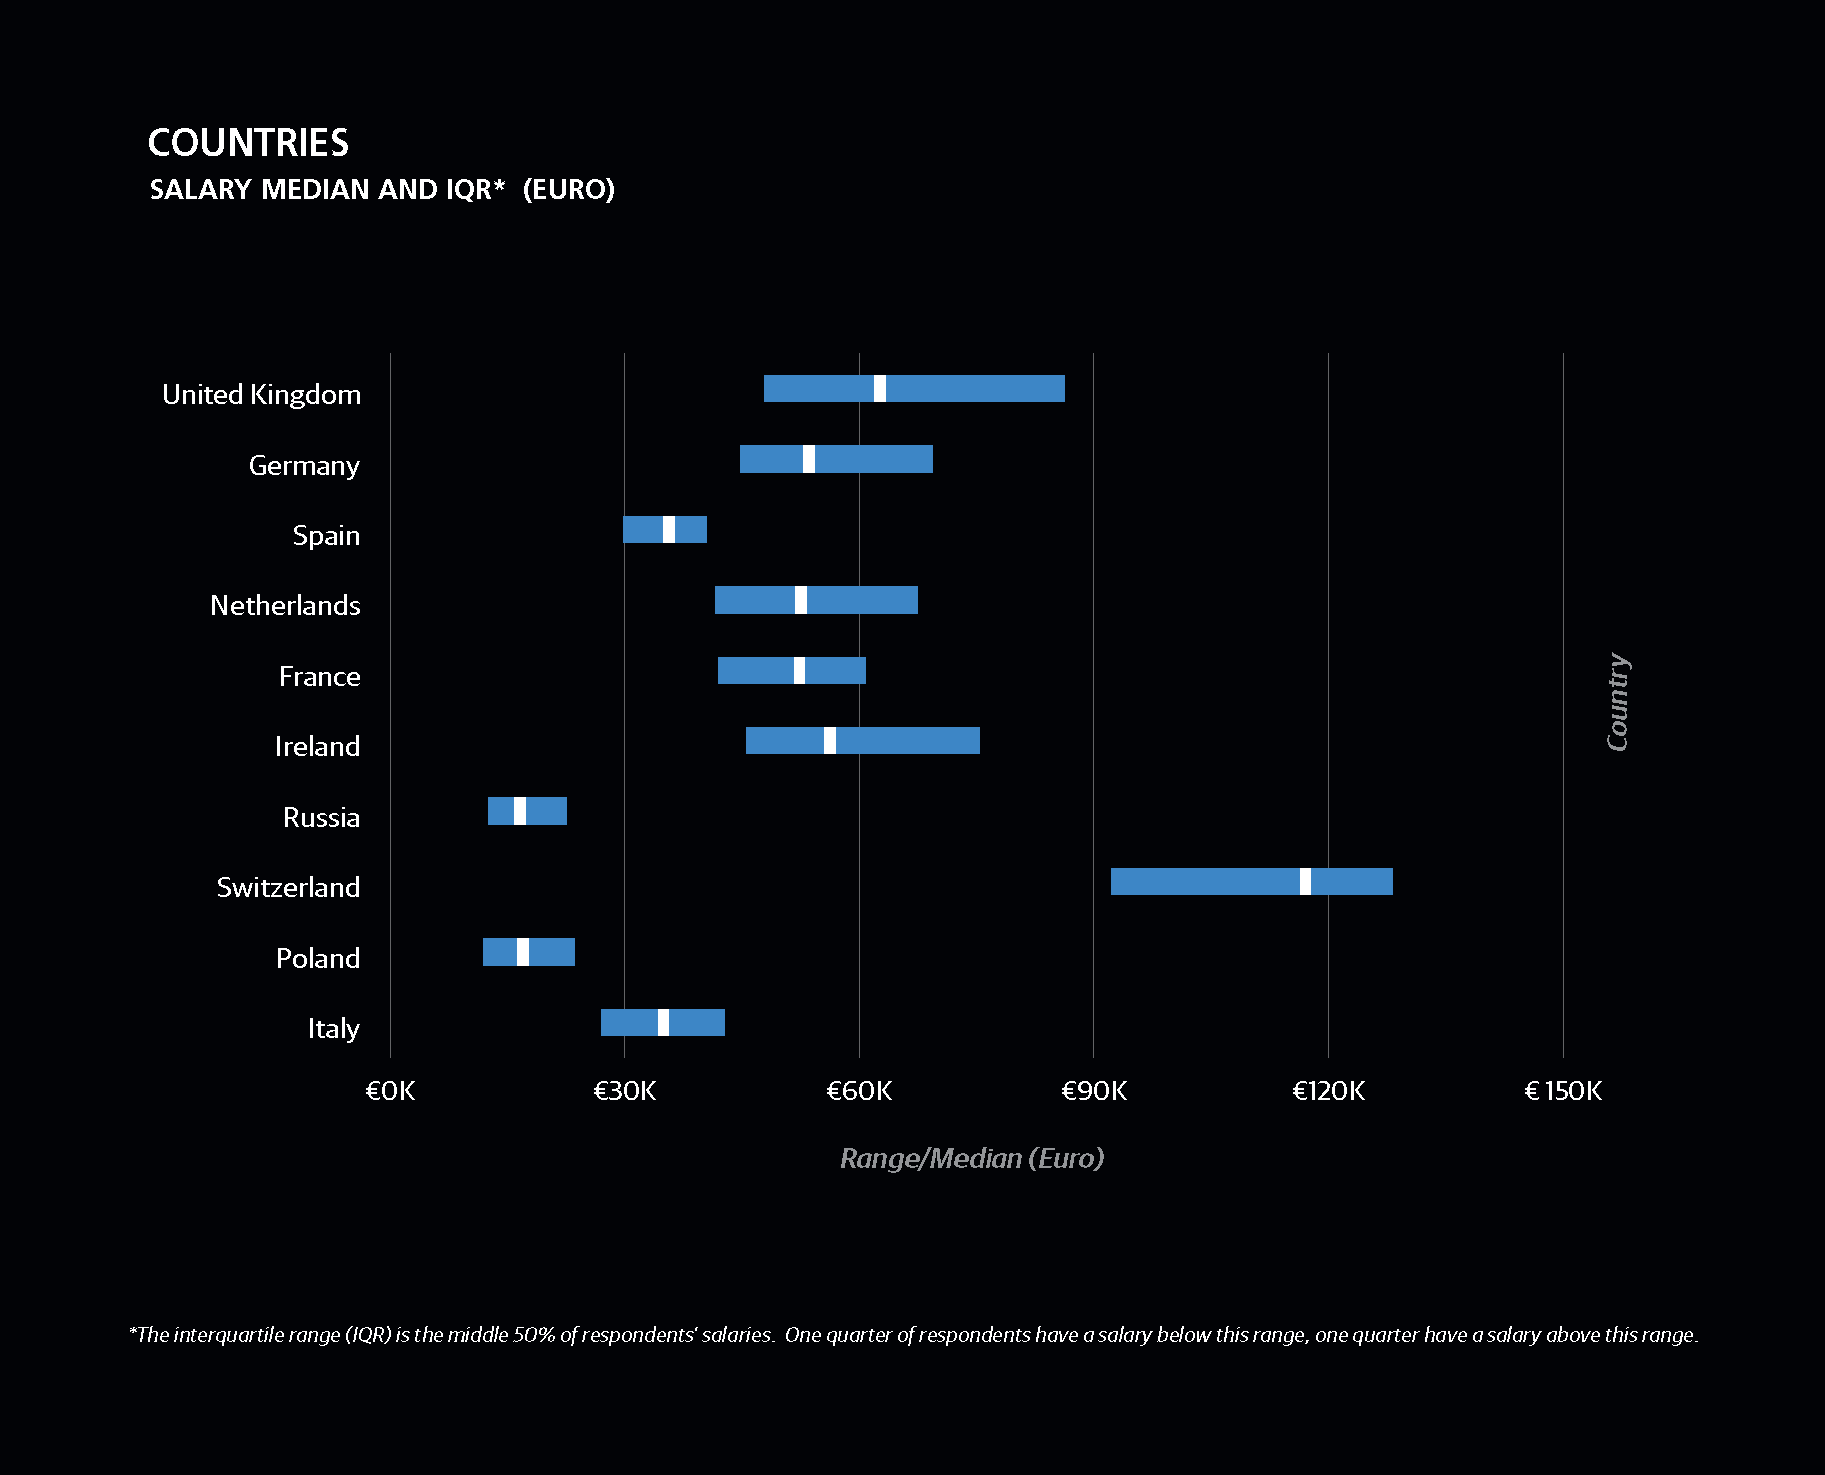
THE UK WAS THE MOST WELL-REPRESENTED EUROPEANCOUNTRY, with about a quarter of the sample, followedby Germany, Spain, and the Netherlands. By far, the highestsalaries were in Switzerland, witha median salary of 117K, followedby Norway with 96K, althoughthe latter figure is only based onfive respondents. Among countriesrepresented by more than just ahandful of respondents, the UK hadthe second-highest median salary:63k (53).
Even within Western Europe, there was significant variationin salary. While UK, Swiss, and Scandinavian salaries weresignificantly higher than the Western European median of 54K, Spanish and Italian respondents tended to have muchlower salaries (35K). Portugal was somewhat of an outlier inWestern Europe, with a median of 22K. The median salariesof Germany, the Netherlands, andFrance were close to the regionalmedian (about 53K).
Salaries drop dramatically as wemove south and east. The mediansalary of respondents from Centraland Eastern Europe was 17K. Russiaand Poland, the two most well-representedcountries in this half of thecontinent, also had median salaries of 17K: unlike in the west,Eastern European salaries appeared to be fairly consistent,even across national borders.
Unlike in the west, EasternEuropean salaries appearedto be fairly consistent, evenacross national borders.
NATIONAL MEDIAN SALARIES SHOULD BE EXPECTEDTO VARY according to the economicconditions of the country, so thequestion becomes: given a countryseconomy (in particular, its per capitaGDP), do the salaries of data scientistsand engineers vary? Here, we plot percapita GDP and median salary of eachcountry in the sample. The resultinggraph is remarkably linear, with outlierslargely explained by small sample size:Greece, for example, has a higher-than-expected median salary given arelatively low per capita GDP, but this isbased on just one respondent.
One shortcoming of this plot is that it does not take into accountyears of experience, which turnsout to be very uneven in the sampleamong different countries. In particular,respondents from Western Europetended to be much more experienced(with an average of seven years) thanrespondents from Eastern Europe(with an average of four years).Since experience correlates with salary,the West-East salary difference isexaggerated due to this experiencedifferential.
Font size:
Interval:
Bookmark:
Similar books «2017 European Data Science Salary Survey»
Look at similar books to 2017 European Data Science Salary Survey. We have selected literature similar in name and meaning in the hope of providing readers with more options to find new, interesting, not yet read works.
Discussion, reviews of the book 2017 European Data Science Salary Survey and just readers' own opinions. Leave your comments, write what you think about the work, its meaning or the main characters. Specify what exactly you liked and what you didn't like, and why you think so.