• Complain

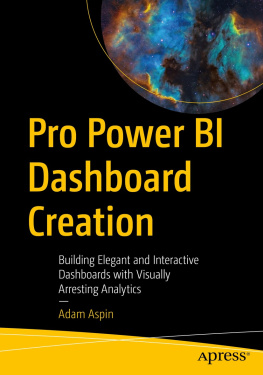
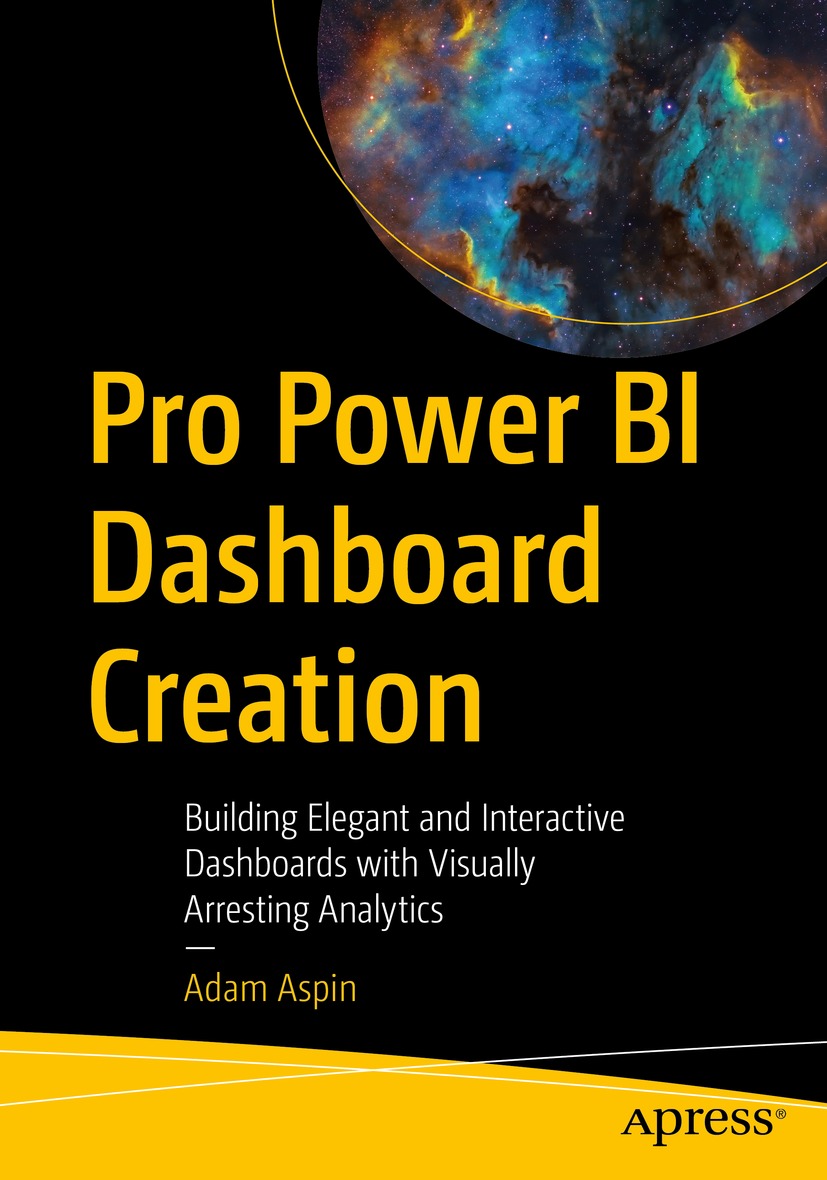
Adam Aspin - Pro Power BI Dashboard Creation: Building Elegant and Interactive Dashboards with Visually Arresting Analytics

Here you can read online Adam Aspin - Pro Power BI Dashboard Creation: Building Elegant and Interactive Dashboards with Visually Arresting Analytics full text of the book (entire story) in english for free. Download pdf and epub, get meaning, cover and reviews about this ebook. year: 2022, publisher: Apress, genre: Computer. Description of the work, (preface) as well as reviews are available. Best literature library LitArk.com created for fans of good reading and offers a wide selection of genres:

Romance novel Science fiction Adventure Detective Science History Home and family Prose Art Politics Computer Non-fiction Religion Business Children Humor

Choose a favorite category and find really read worthwhile books. Enjoy immersion in the world of imagination, feel the emotions of the characters or learn something new for yourself, make an fascinating discovery.

Adam Aspin Pro Power BI Dashboard Creation: Building Elegant and Interactive Dashboards with Visually Arresting Analytics
  • Book:
    Pro Power BI Dashboard Creation: Building Elegant and Interactive Dashboards with Visually Arresting Analytics
  • Author:
  • Publisher:
    Apress
  • Genre:
  • Year:
    2022
  • Rating:
    4 / 5
  • Favourites:
    Add to favourites
  • Your mark:
    • 80
    • 1
    • 2
    • 3
    • 4
    • 5

Pro Power BI Dashboard Creation: Building Elegant and Interactive Dashboards with Visually Arresting Analytics: summary, description and annotation

We offer to read an annotation, description, summary or preface (depends on what the author of the book "Pro Power BI Dashboard Creation: Building Elegant and Interactive Dashboards with Visually Arresting Analytics" wrote himself). If you haven't found the necessary information about the book — write in the comments, we will try to find it.

Produce high-quality, visually attractive analysis quickly and effectively with Microsofts key BI tool. This book teaches analysts, managers, power users, and developers how to harness the power of Microsofts self-service business intelligence flagship product to deliver compelling and interactive insight with remarkable ease. It then shows you the essential techniques needed to go from source data to dashboards that seize your audiences attention and provide them with clear and accurate information.
As well as producing elegant and visually arresting output, you learn how to enhance the user experience through adding polished interactivity. This book shows you how to make interactive dashboards that allow you to guide users through the meaning of the data that they are exploring. Drill down features are also covered that allow you and your audience to dig deeper and uncover new insights by exploring anomalous and interesting data points.
Reading this book builds your skills around creating meaningful and elegant dashboards using a range of compelling visuals. It shows you how to apply simple techniques to convert data into business insight. The book covers tablet and smartphone layouts for delivering business value in todays highly mobile world. Youll learn about formatting for effect to make your data tell its story, and youll be a master at creating visually arresting output on multiple devices that grabs attention, builds influence, and drives change.
What You Will Learn
  • Produce designer output that will astound your bosses and peers
  • Make new insights as you chop and tweak your data as never before
  • Create high-quality analyses in record time
  • Create interdependent charts, maps, and tables
  • Deliver visually stunning information
  • Drill down through data to provide unique understandings
  • Outshine competing products and enhance existing skills
  • Adapt your dashboard delivery to mobile devices

Who This Book Is For
For any Power BI user who wants to strengthen their ability to deliver compelling analytics via Microsofts widely adopted analytics platform. For those new to Power BI who want to learn the full extent of what the platform is capable of. For power users such as BI analysts, data architects, IT managers, accountants, and C-suite members who want to drive change in their organizations.

Pro Power BI Dashboard Creation: Building Elegant and Interactive Dashboards with Visually Arresting Analytics — read online for free the complete book (whole text) full work

Below is the text of the book, divided by pages. System saving the place of the last page read, allows you to conveniently read the book "Pro Power BI Dashboard Creation: Building Elegant and Interactive Dashboards with Visually Arresting Analytics" online for free, without having to search again every time where you left off. Put a bookmark, and you can go to the page where you finished reading at any time.

Light

Font size:

Reset

Interval:

Bookmark:

Make
Adam Aspin Pro Power BI Dashboard Creation Building Elegant and Interactive - photo 1
Adam Aspin
Pro Power BI Dashboard Creation
Building Elegant and Interactive Dashboards with Visually Arresting Analytics
A logo of Apress R Adam Aspin STAFFORD UK ISBN 978-1-4842-8226-7 e-ISBN - photo 2

A logo of Apress R.

Adam Aspin
STAFFORD, UK
ISBN 978-1-4842-8226-7 e-ISBN 978-1-4842-8227-4
https://doi.org/10.1007/978-1-4842-8227-4
Adam Aspin 2022
This work is subject to copyright. All rights are solely and exclusively licensed by the Publisher, whether the whole or part of the material is concerned, specifically the rights of translation, reprinting, reuse of illustrations, recitation, broadcasting, reproduction on microfilms or in any other physical way, and transmission or information storage and retrieval, electronic adaptation, computer software, or by similar or dissimilar methodology now known or hereafter developed.
The use of general descriptive names, registered names, trademarks, service marks, etc. in this publication does not imply, even in the absence of a specific statement, that such names are exempt from the relevant protective laws and regulations and therefore free for general use.
The publisher, the authors and the editors are safe to assume that the advice and information in this book are believed to be true and accurate at the date of publication. Neither the publisher nor the authors or the editors give a warranty, expressed or implied, with respect to the material contained herein or for any errors or omissions that may have been made. The publisher remains neutral with regard to jurisdictional claims in published maps and institutional affiliations.

This Apress imprint is published by the registered company APress Media, LLC, part of Springer Nature.

The registered company address is: 1 New York Plaza, New York, NY 10004, U.S.A.

Introduction

Business intelligence (BI) is a concept that has been around for many years. Until recently, it has too often been a domain reserved for large corporations with teams of dedicated IT specialists. All too frequently, this has meant developing complex solutions using expensive products on timescales that did not meet business needs. All this has changed with the advent of self-service business intelligence.

Now a user with a reasonable knowledge of Microsoft Office can leverage their skills to produce their own analyses with minimal support from central IT. Then they can deliver their insights to colleagues safely and securely via the cloud. This democratization has been made possible by a superb free product from MicrosoftPower BI Desktopthat revolutionizes the way in which data is discovered, captured, structured, and shaped so that it can be sliced, diced, chopped, queried, and presented in an interactive and intensely visual way.

Power BI Desktop provides you with the capability to analyze and present your data and to shape and deliver your results easily and impressively. All this can be achieved in a fraction of the time that it would take to specify, develop, and test a corporate solution. To cap it all off, self-service BI with Power BI Desktop lets you produce reports at a fraction of the cost of more traditional solutions, with far less rigidity and overhead.

The aim of this short book is to introduce the reader to this brave new world of user-driven dashboard development. This will not involve a complete tour of Power BI Desktop, however. The product is simply too vast for that. Consequently, this book concentrates on the visual aspects of BI and specifically on dashboard development. If you need to learn further aspects of the Power BI Desktop ecosystem, then two companion volumes are available:
  • Pro DAX and Data Modeling in Power BI

  • Pro Data Mashup for Power BI

The first explains how to extend Power BI by melding disparate data sources into a unified data model that you then extend using DAXthe built-in analytics language. The second guides you through the process of ingesting, cleansing, and shaping source datasets to underpin your dashboard creation.

Although a basic knowledge of the MS Office suite will help, this book presumes that you have little or no knowledge of Power BI Desktop. This product is therefore explained from the ground up with the aim of providing the most complete coverage possible of the way in which its components work together to deliver user-driven dashboards. Hopefully, if you read the book and follow the examples given, you will arrive at a level of practical knowledge and confidence that you can subsequently apply to your own dashboard requirements. This book should prove invaluable to business intelligence developers, MS Office power users, IT managers, and finance expertsindeed anyone who wants to deliver efficient and practical business intelligence to their colleagues. Whether your aim is to develop a proof of concept or to deliver a fully-fledged BI system, this book can, hopefully, be your guide and mentor.

You can, if you wish, read this book from start to finish, as it is designed to be a progressive self-tutorial. However, as dashboard development with Power BI Desktop is the interaction of a set of interdependent BI techniques, the book is broken down into several separate areas that correspond to the various facets of the product. They are
  • Chapter : This provides a high-level overview of Power BI Desktop for newcomers to the product.

  • Chapters : These chapters cover tables, matrices, and other text-based visuals such as cards.

  • Chapters : These chapters are an introduction to the range of chart types that are available in Power BI Desktop.

  • Chapter : This chapter introduces the other visual types that are built into Power BI.

  • Chapter : This chapter takes you through a tour of drill down techniques across a range of visuals.

  • Chapter : This chapter helps you to discover some of the gamut of third-party visuals that you can add to Power BI Desktop to extend the variety of data display types.

  • Chapter : This chapter illustrates how you can use maps to enhance your dashboards.

  • Chapters : These chapters delve into filtering and slicing data in a dashboard.

  • Chapter : These chapters explain how to enhance dashboards by enhancing the interface and taking the user on a data-driven journey.

This book comes with a small sample dataset that you can use to follow the examples that are provided. It may seem paradoxical to use a tiny data sample when explaining a product suite that is capable of analyzing medium and large datasets. However, I prefer to use an extremely simplistic data structure so that the reader is free to focus on the essence of what is being explained and not the data itself.

Inevitably, not every question can be answered and not every issue can be resolved in one book. I truly hope that I have answered many of the essential Power BI questions that you will face when developing dashboards. Equally, I hope that I have provided ways of solving a reasonable number of the challenges that you may encounter. I wish you good luck in using Power BI Desktop to prepare and deliver your insights. And I sincerely hope that you have as much fun with it as I had writing this book.

Next page
Light

Font size:

Reset

Interval:

Bookmark:

Make

Similar books «Pro Power BI Dashboard Creation: Building Elegant and Interactive Dashboards with Visually Arresting Analytics»

Look at similar books to Pro Power BI Dashboard Creation: Building Elegant and Interactive Dashboards with Visually Arresting Analytics. We have selected literature similar in name and meaning in the hope of providing readers with more options to find new, interesting, not yet read works.


Reviews about «Pro Power BI Dashboard Creation: Building Elegant and Interactive Dashboards with Visually Arresting Analytics»

Discussion, reviews of the book Pro Power BI Dashboard Creation: Building Elegant and Interactive Dashboards with Visually Arresting Analytics and just readers' own opinions. Leave your comments, write what you think about the work, its meaning or the main characters. Specify what exactly you liked and what you didn't like, and why you think so.