Using
Climate
Maps
Rebecca E. Hirsch
Copyright 2017 by Lerner Publishing Group, Inc.
All rights reserved. International copyright secured. No part of this book may be
reproduced, stored in a retrieval system, or transmitted in any form or by any means
electronic, mechanical, photocopying, recording, or otherwisewithout the prior written
permission of Lerner Publishing Group, Inc., except for the inclusion of brief quotations in
an acknowledged review.
Lerner Publications Company
A division of Lerner Publishing Group, Inc.
241 First Avenue North
Minneapolis, MN 55401 USA
For reading levels and more information, look up this title
at www.lernerbooks.com.
Library of Congress Cataloging-in-Publication Data
Names: Hirsch, Rebecca E., author.
Title: Using climate maps / Rebecca E. Hirsch.
Description: Minneapolis : Lerner Publications, [2017] | Series: Searchlight Books. What
Do You Know about Maps? | Includes bibliographical references and index.
Identifiers: LCCN 2015044351 (print) | LCCN 2016001199 (ebook) | ISBN 9781512409505
(lb : alk. paper) | ISBN 9781512412918 (pb : alk. paper) | ISBN 9781512410709 (eb pdf)
Subjects: LCSH: MapsJuvenile literature. | WeatherMapsJuvenile literature.
Classification: LCC GA105.6 .H57 2017 (print) | LCC GA105.6 (ebook) | DDC 912.01/4
dc23
LC record available at http://lccn.loc.gov/2015044351
Manufactured in the United States of America
1-39539-21243-3/15/2016
Contents
WHAT IS
A CLIMATE
MAP? ... page
WHATS ON A
CLIMATE MAP? ... page
HOW DO YOU USE
A CLIMATE MAP? ... page
Chapter
WHAT IS A
CLIMATE MAP?
Imagine you want to plant
a garden. You want your
garden in a spot that is
warm and sunny. You have
a map that shows you the
conditions in your yard. The
map shows that the area under
the tree is cool and shady. It
shows you that a spot near the
back door is sunny. Now you know
where to plant your garden.
A climate map can help you choose a
spot to plant a garden. What kind of
information does a climate map show?
A map is a diagram that represents a place. The
place shown on a map may be big, like the whole world,
or small, like a backyard. Maps can show different kinds
of information about a place. Some maps show the
natural features of a place, such as mountains, rivers, and
forests. Some maps show information about the climate,
like the map of the yard. These are called climate maps.
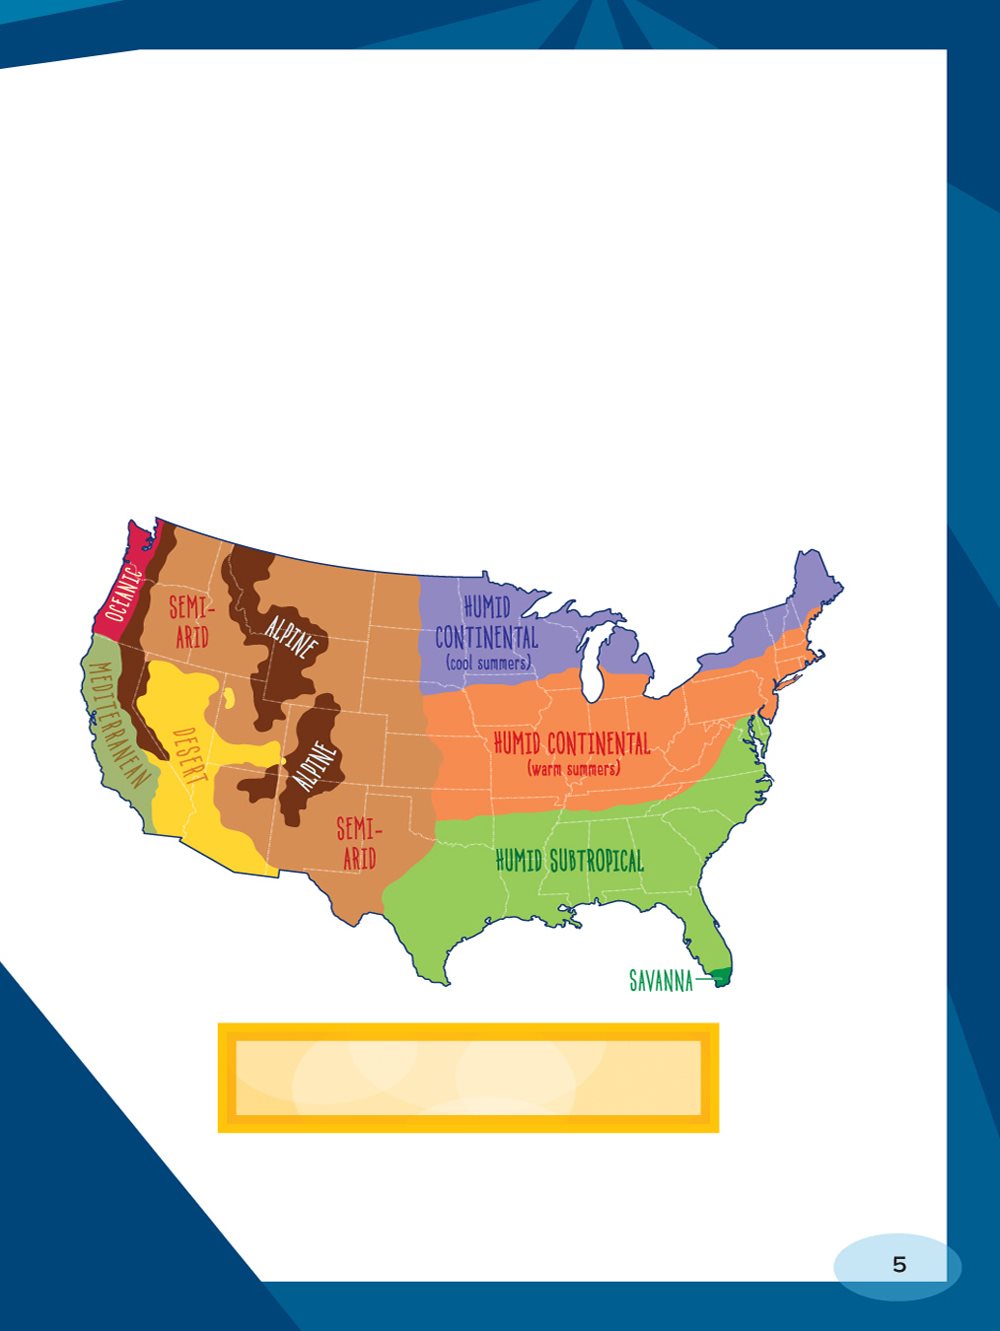
This map shows different climates
in the lower forty- eight US states.
A climate map can show the temperature of a certain
place. It could show how much, if any, snow falls. These
are some important features of climate. Other climate
features are fog, humidity, and the strength and speed of
the wind.
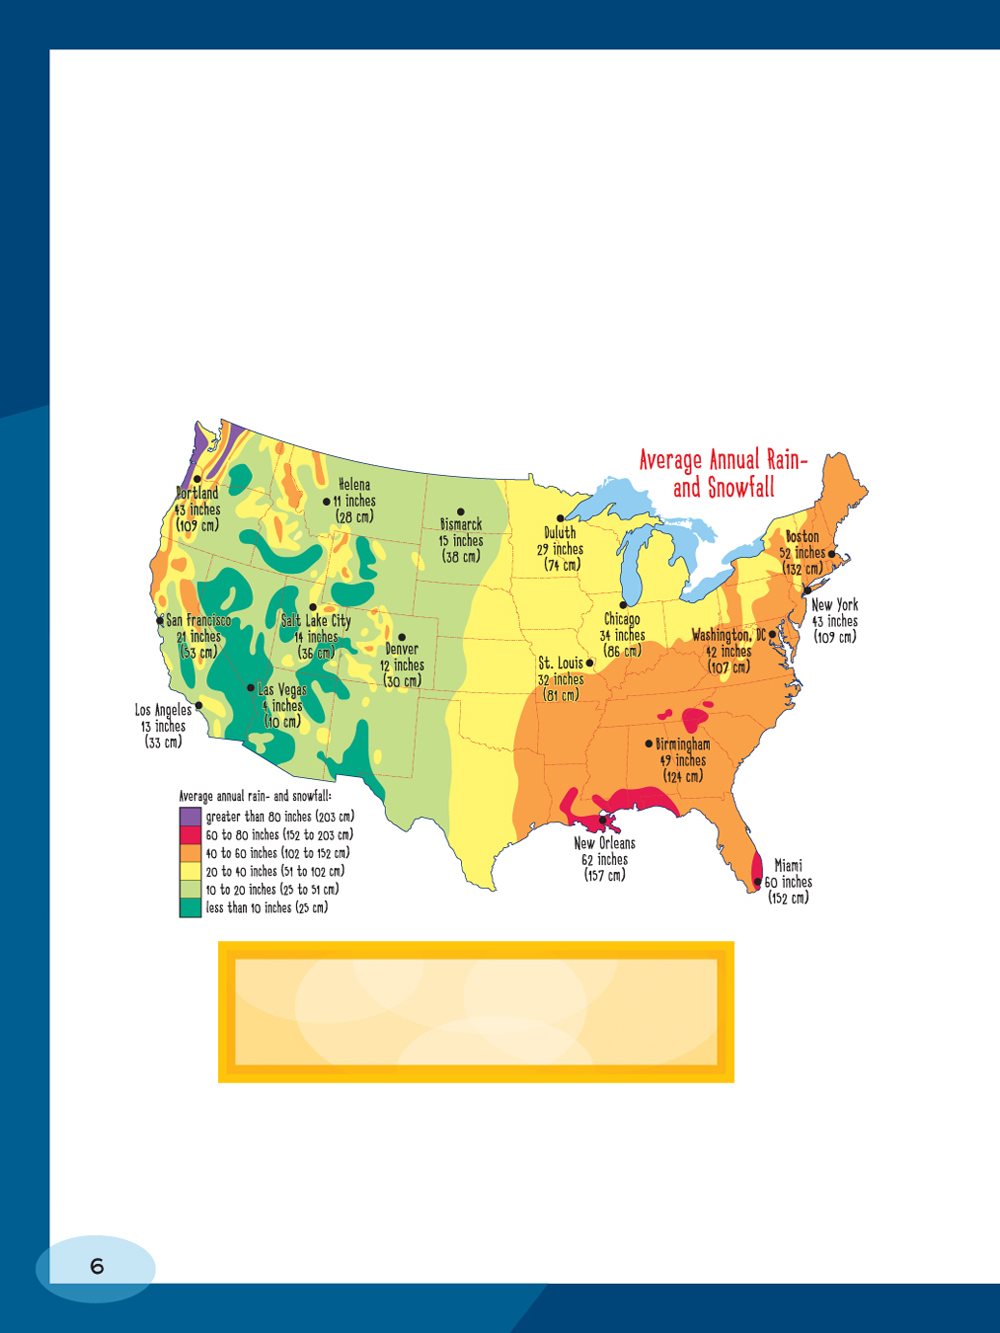
On this map, you can see the average
yearly amount of rain and snow in
different parts of the United States.
Climate vs. Weather
A climate map doesnt show the weather. Weather
refers to short- term conditions, like whether it is raining
or sunny outside. Weather can change from hour to
hour or day to day. Climate is the usual weather in
a place. Climate doesnt change from day to day. A
climate map shows the average conditions that have
taken place over many years.
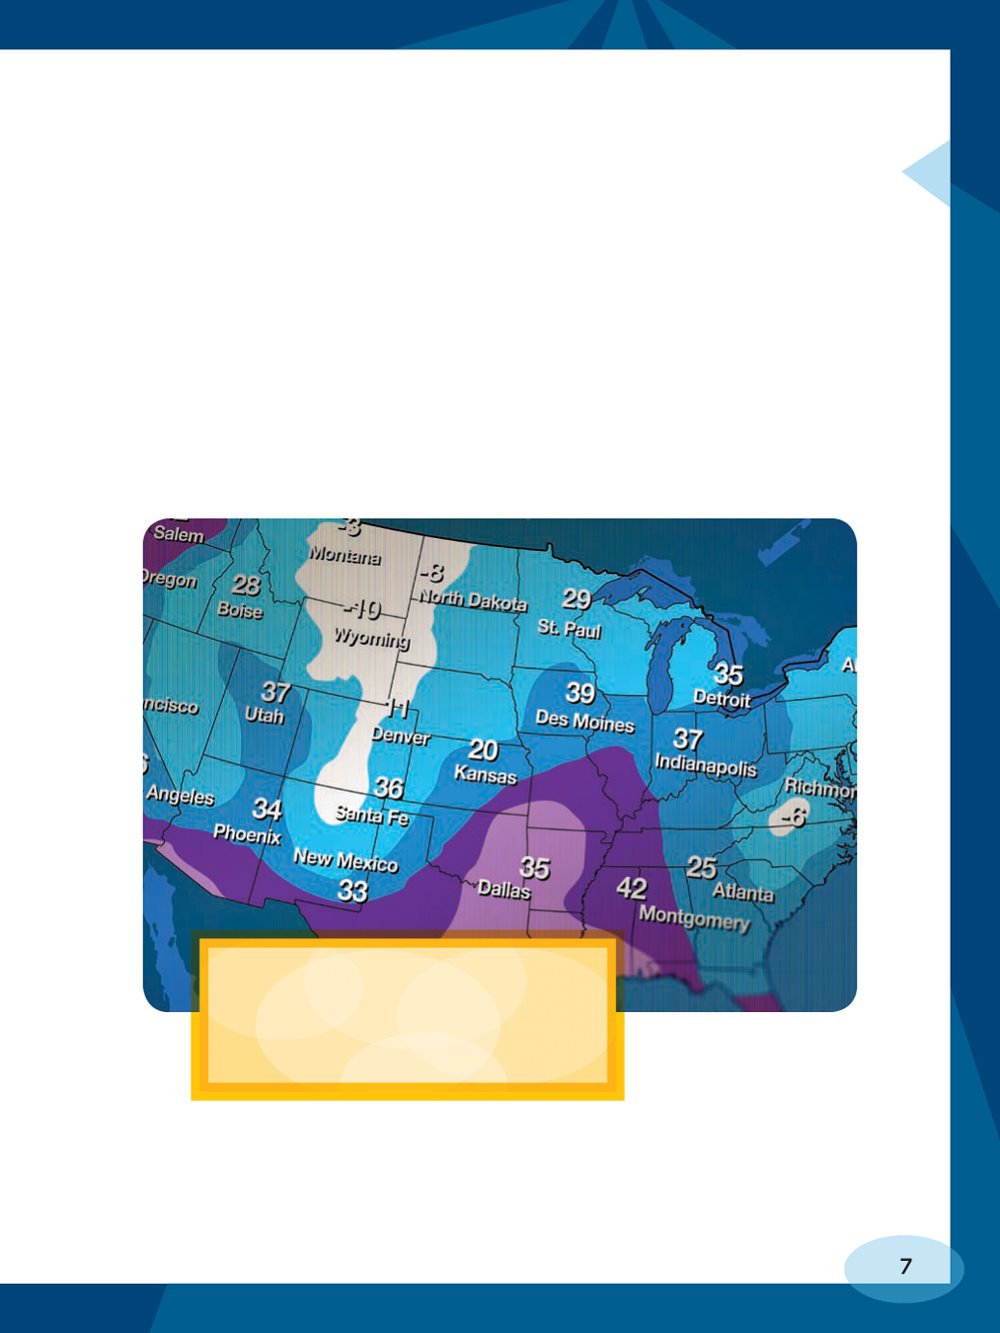
This map showing temperatures
is a weather map, not a climate
map. It gives information about
temperatures on a certain day.
What Climate Maps Show
A climate map may show a small region, such as a town.
Or it may show different climates around the world.
Some parts of the world are hot and rainy. They have a
tropical, wet climate. Others are cold and snowy. They
have a polar climate. In between are many other climates.
Any kind of climate might appear on a climate map.
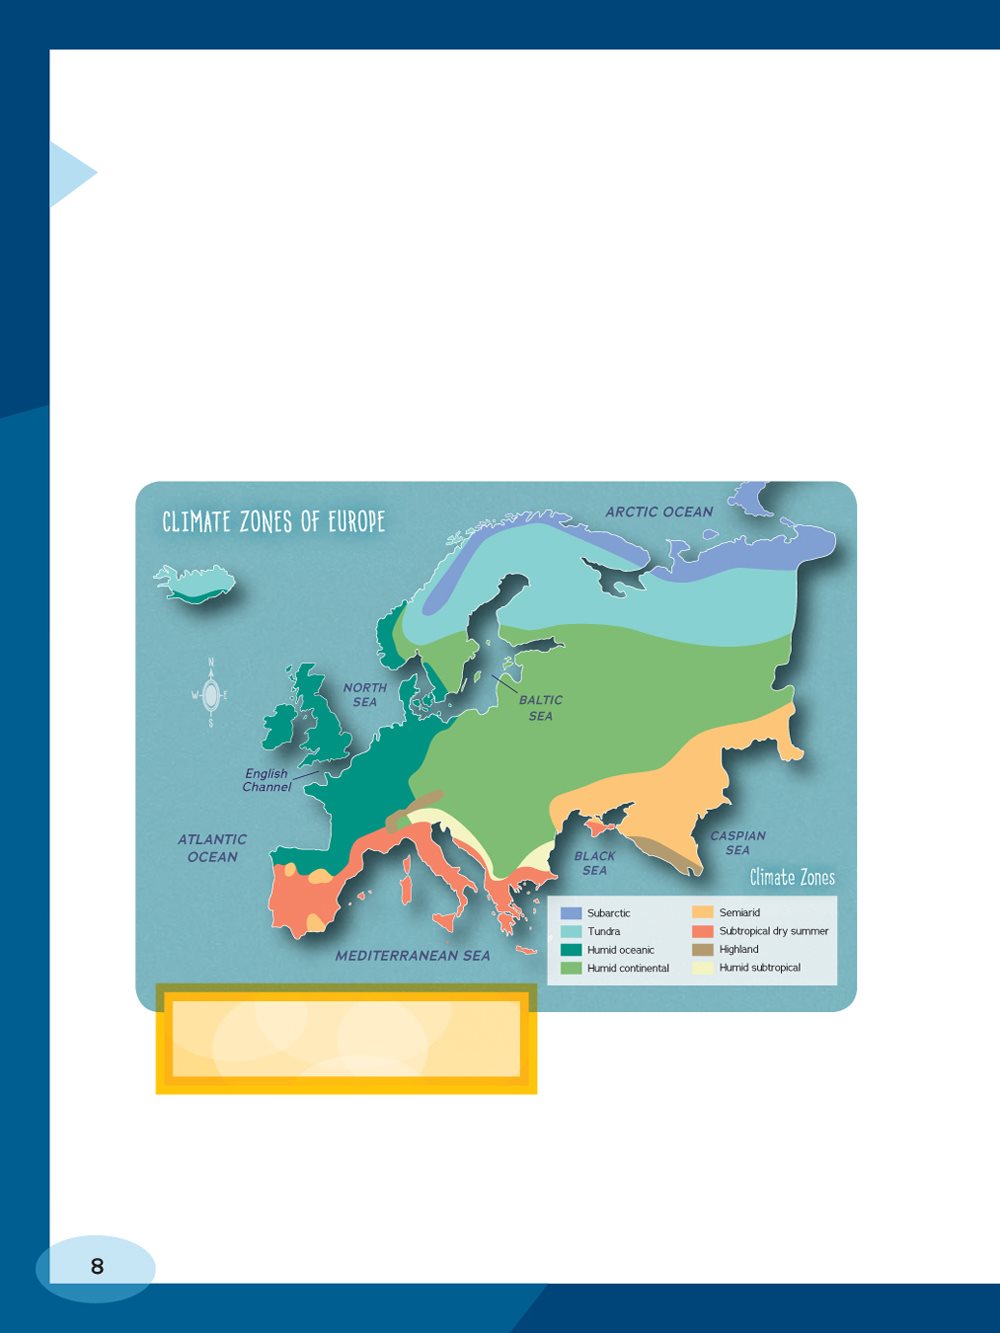
This climate map focuses
on the continent of Europe.
No single map can show everything. So cartographers
(people who make maps) choose which features to show.
They include only the features that will help people using
the map.
A climate map usually shows one type of climate
condition. It might show the amount of rain an area
receives or the percentage of cloudy days. A single map
wont show all the climate conditions.
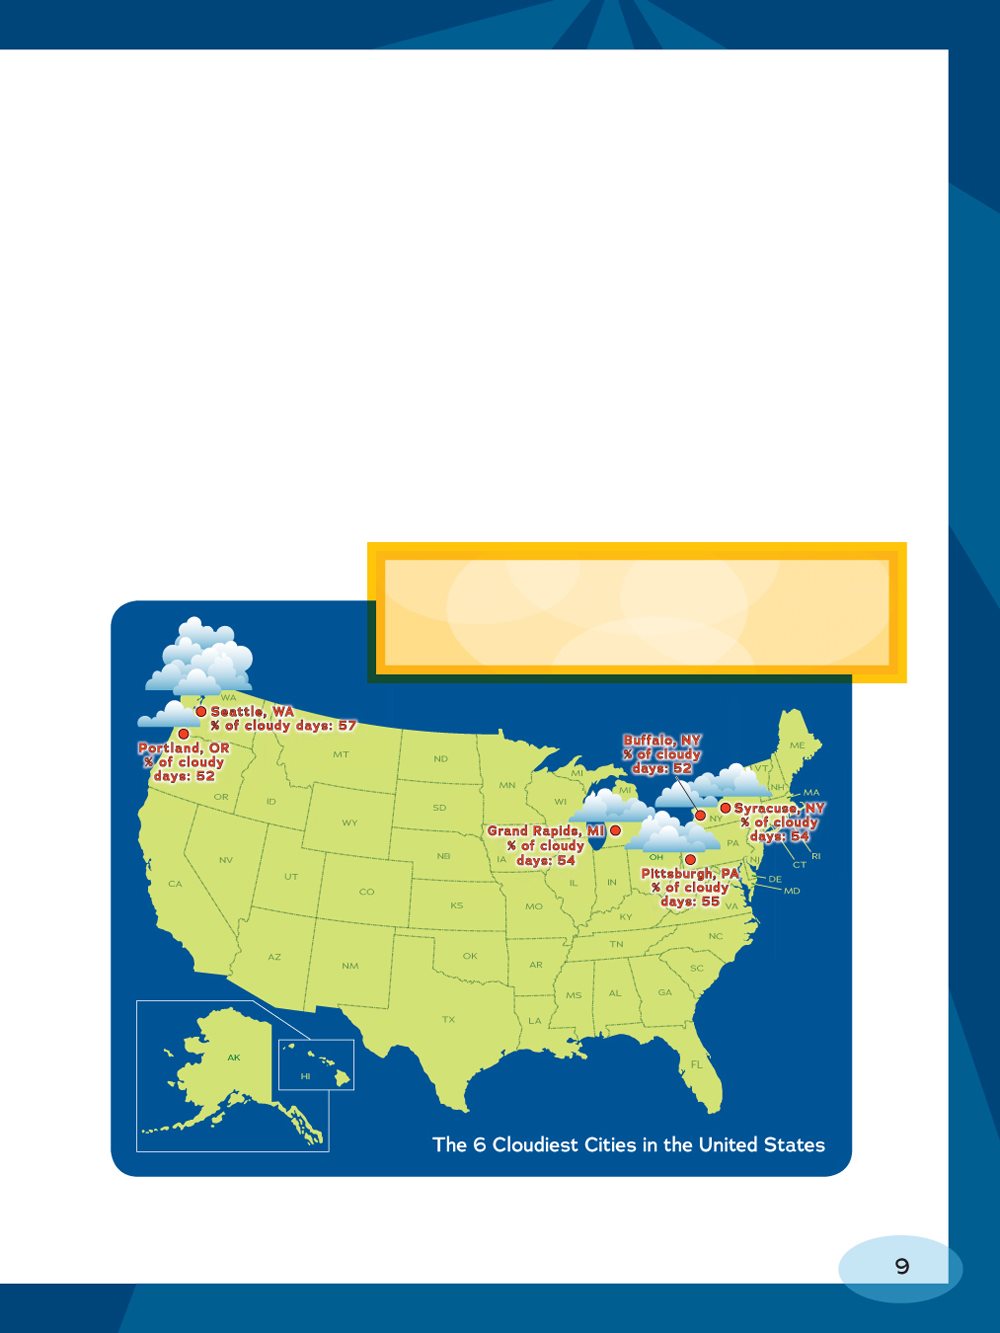
This climate map shows which US
cities have some of the highest
percentages of cloudy days on average.
Mapping the Climate of Mars
Scientists have mapped the climate on Mars. They
have created maps showing different temperatures.
Mars is much colder than Earth. The average
temperature on Mars is about 80F (62C).
Scientists have also mapped storms on Mars. Dust
storms can grow to cover the whole planet. These
giant storms can last for months.
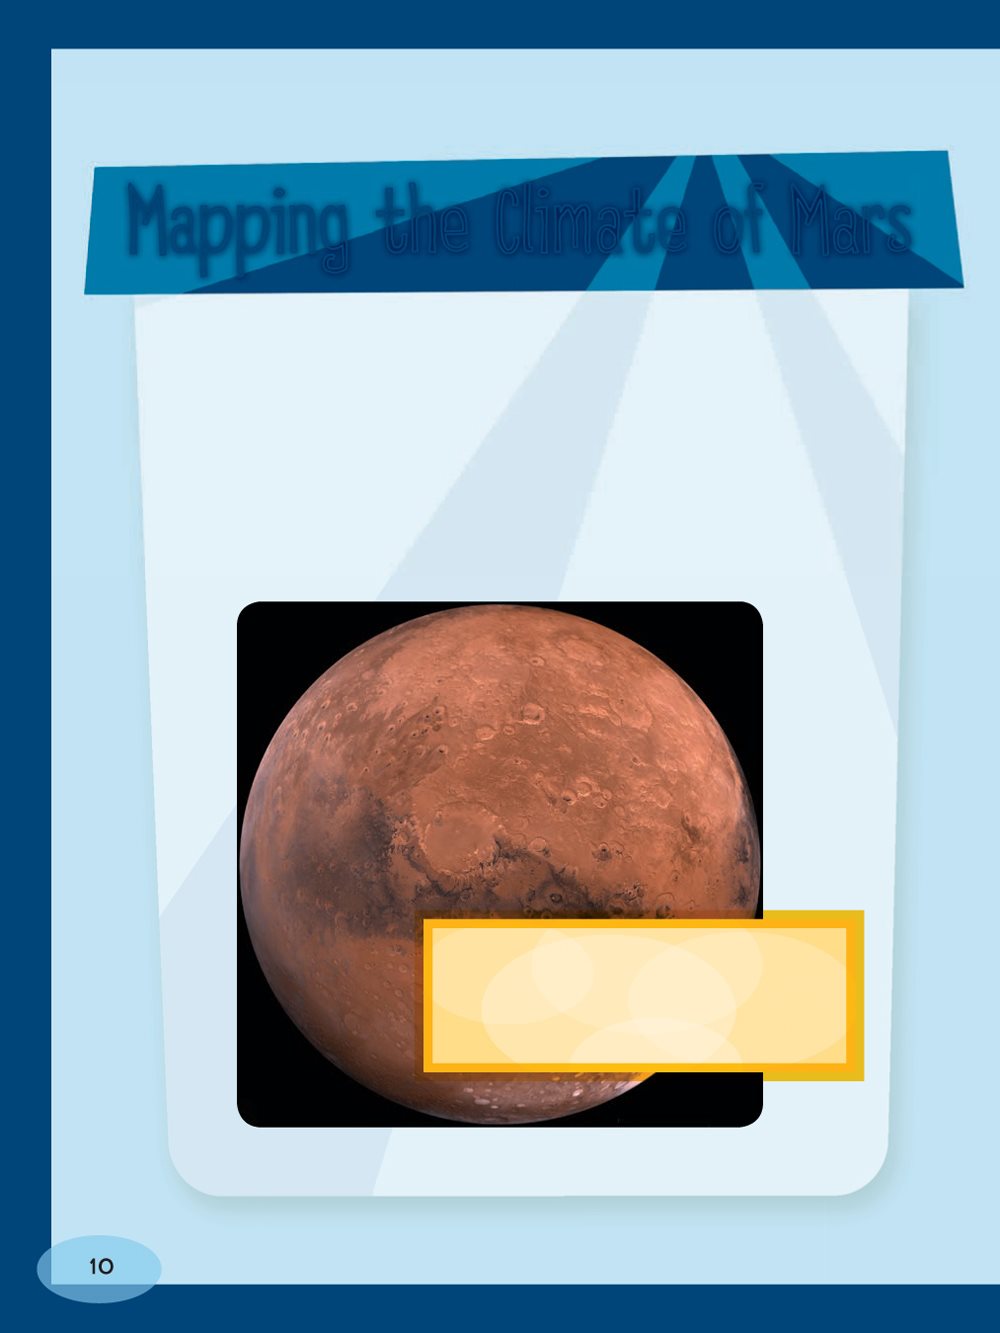
Mars is sometimes called the
red planet. Thats because iron
oxide, or rust, in its soil makes
the planet look red from space.
Chapter
WHATS ON A
CLIMATE MAP?
Climate maps can give you a
great deal of information if you
know how to read them. Maps use
a special language of symbols. These
symbols include colors,
words, and lines. A
legend is a key that will
help you read the map.
The legend explains the
meaning of the symbols
used on the map.
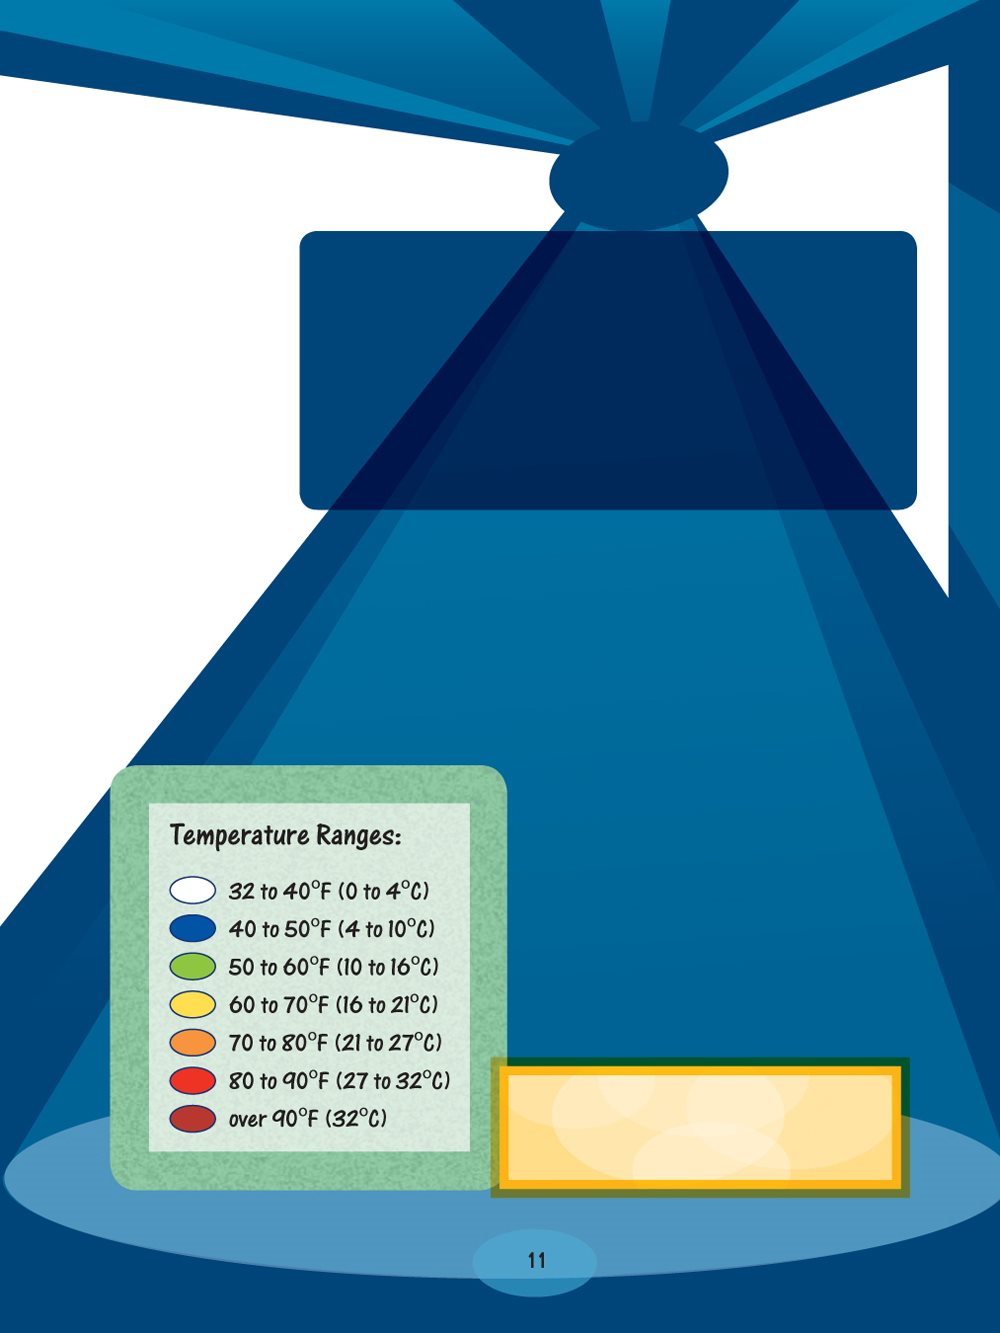
This legend shows the
meaning of different colors
on a map. What is a legend?
Climate maps often share certain features. Many
climate maps have a title. The title tells you what
information the map shows and what place it represents.

